> ## Documentation Index
> Fetch the complete documentation index at: https://docs.textql.com/llms.txt
> Use this file to discover all available pages before exploring further.
# Audit Logs and Metrics via OpenTelemetry
> Stream audit logs and product metrics directly into the observability platforms you already operate — Datadog, Splunk, Grafana, Prometheus, or S3.
Security teams need full visibility into their AI layer, on their own infrastructure. TextQL now supports OpenTelemetry export, letting your team stream audit logs and product metrics directly into the observability platforms you already operate. Bring your own Datadog, Splunk, Grafana, or Prometheus setup.
Both streams are configurable independently.
| Stream | What it exports | Where to configure |
| ------------------- | ------------------------------------------------------------------------- | --------------------------------- |
| **Audit logs** | Key actions in the platform: queries run, connectors configured, and more | Settings → Audit Log → Export tab |
| **Product metrics** | Usage, performance, and operational signals | Observability → Export tab |
## Audit Log Export
Access from **Settings → Audit Log**, then click the **Export** tab.
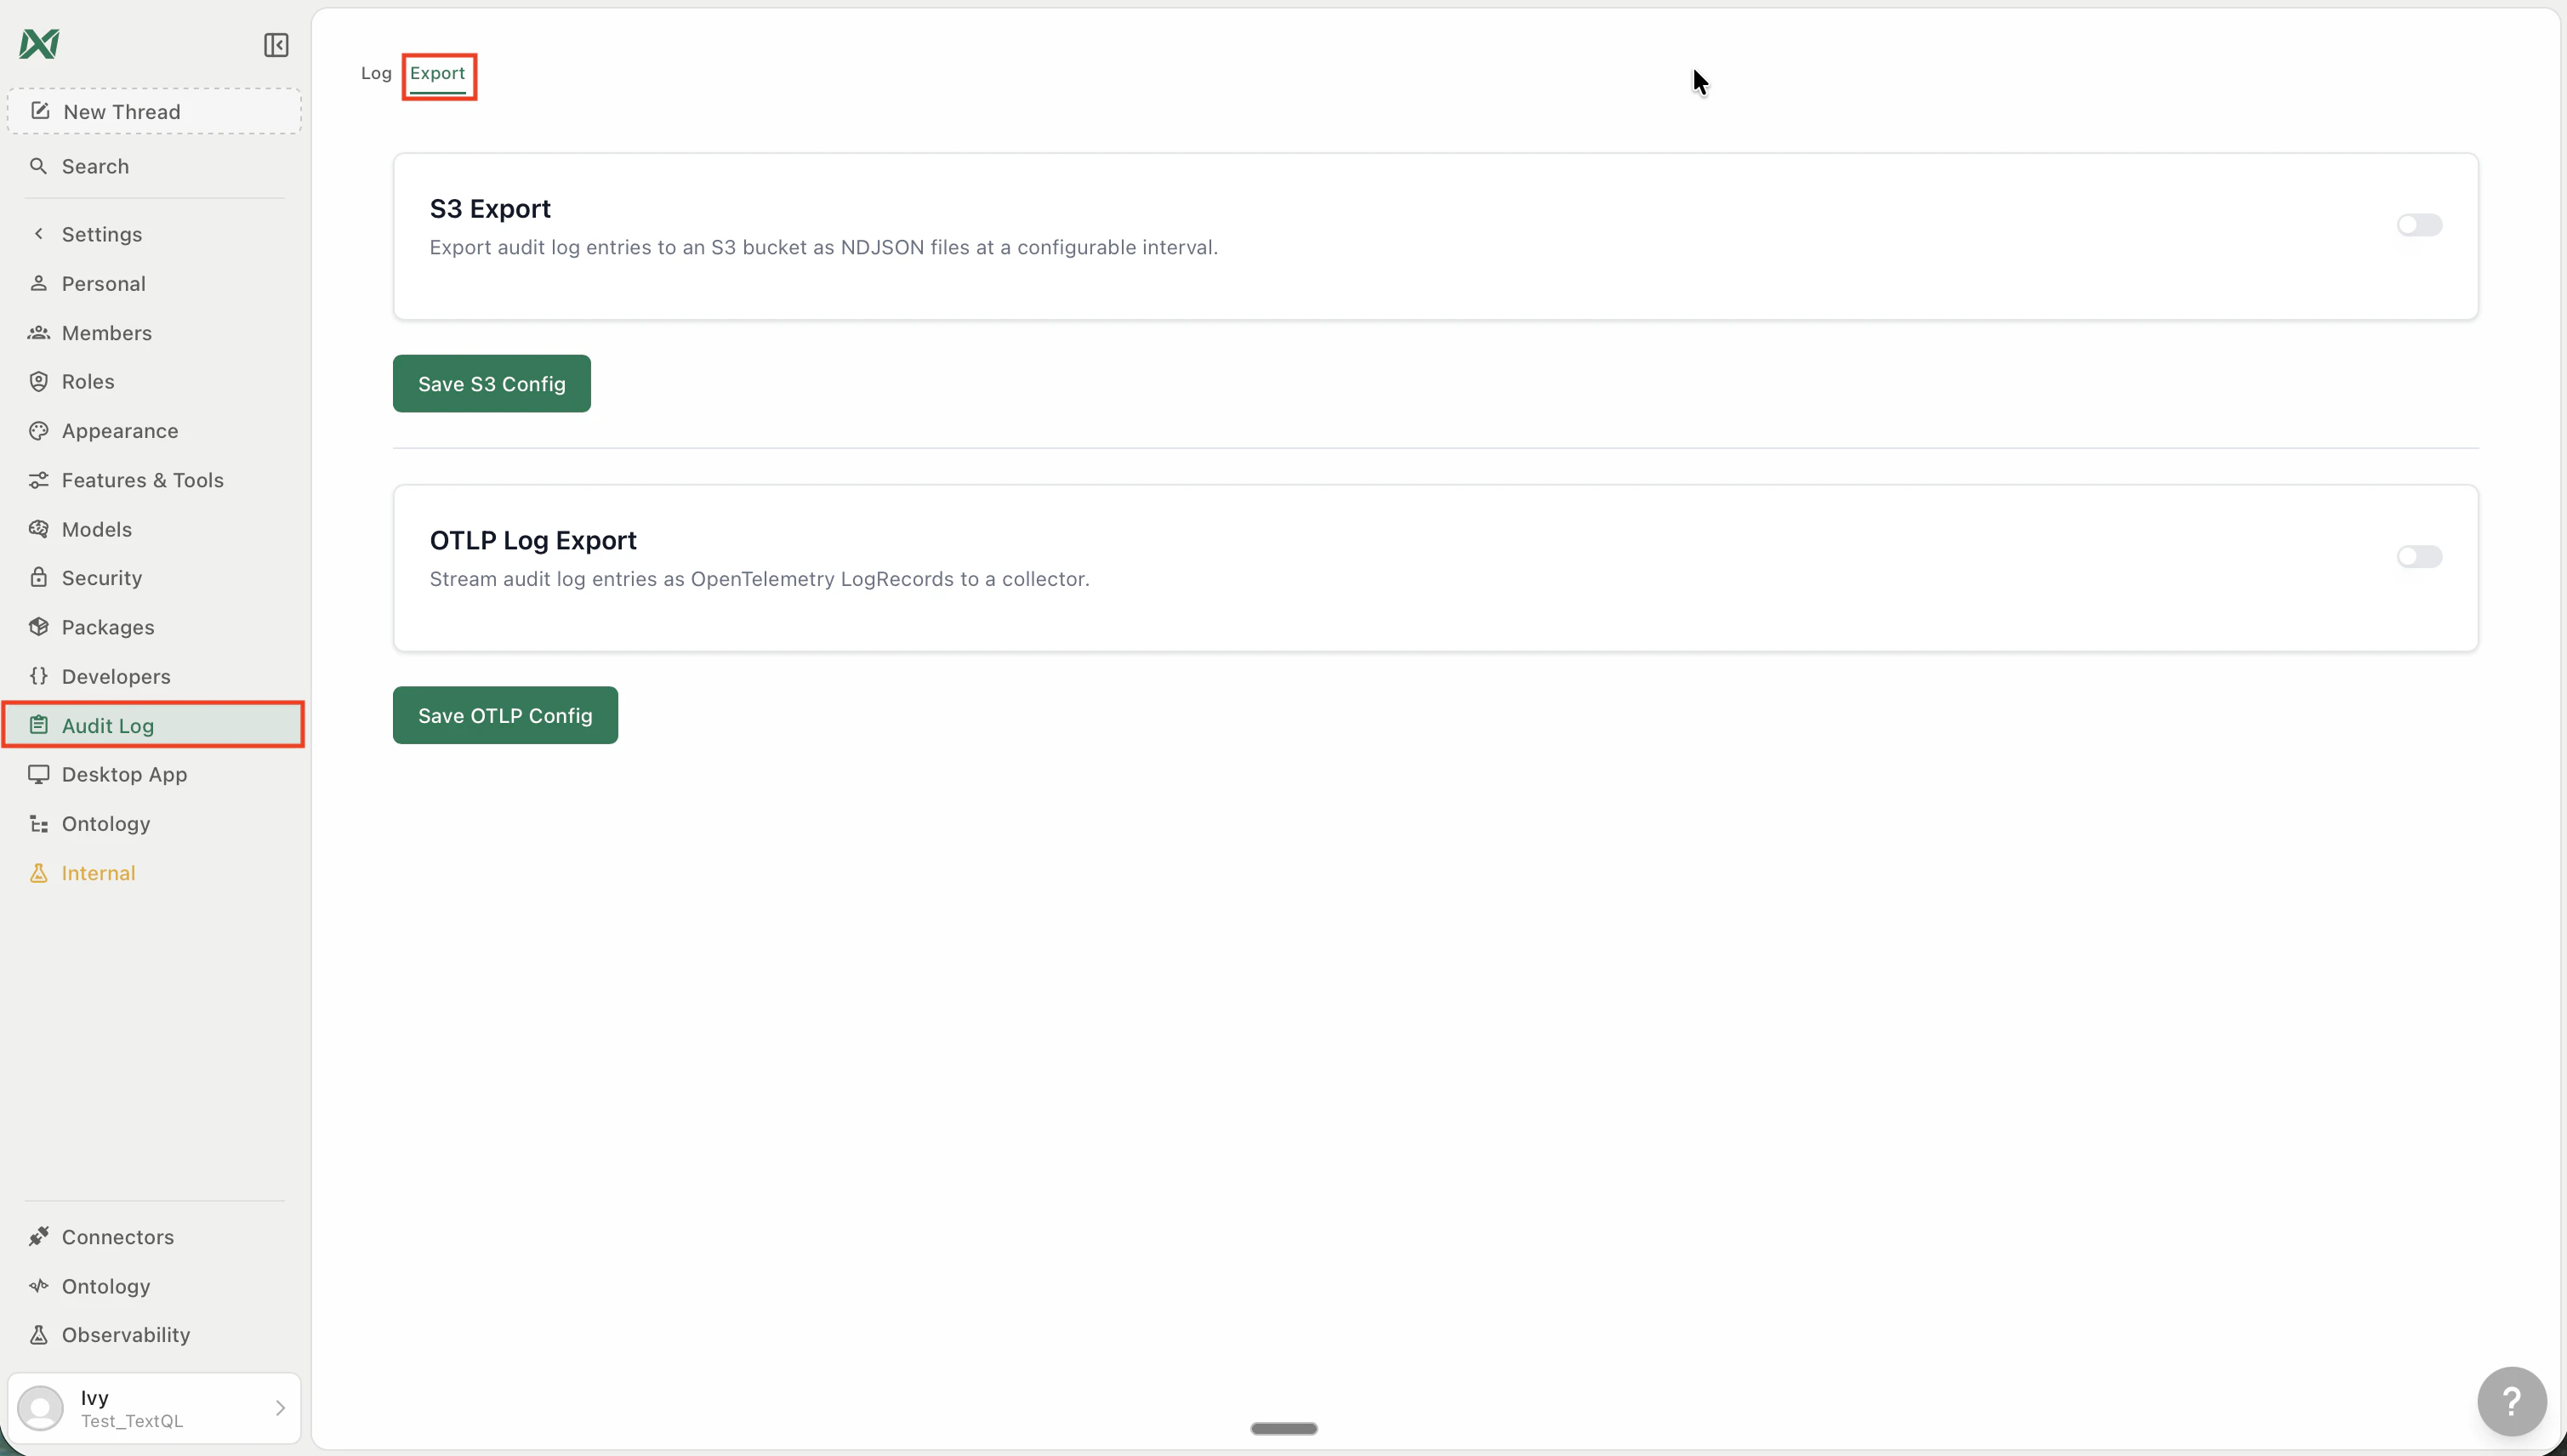 Audit log exports are incremental and scheduled — your downstream systems stay current without gaps or duplicates.
### S3 Export
Exports audit log entries to an Amazon S3 bucket as NDJSON files at a configurable interval.
**To configure:**
1. Go to **Settings → Audit Log → Export**
2. Under **S3 Export**, toggle it on
3. Enter your S3 bucket name, region, and credentials
4. Click **Save S3 Config**
Each export run writes a new NDJSON file to your bucket. Files are named with a timestamp so downstream consumers can process them in order.
### OTLP Log Export
Streams audit log entries as OpenTelemetry `LogRecord` objects to any OTLP-compatible collector — Datadog, Splunk, Grafana Loki, Honeycomb, and others.
**To configure:**
1. Go to **Settings → Audit Log → Export**
2. Under **OTLP Log Export**, toggle it on
3. Enter your OTLP endpoint URL and any required headers (e.g. `Authorization: Bearer `)
4. Click **Save OTLP Config**
Logs are batched and pushed on a recurring schedule. The endpoint must accept OTLP over HTTP.
## Metrics Export
Access from **Observability → Export** in the left sidebar.
Audit log exports are incremental and scheduled — your downstream systems stay current without gaps or duplicates.
### S3 Export
Exports audit log entries to an Amazon S3 bucket as NDJSON files at a configurable interval.
**To configure:**
1. Go to **Settings → Audit Log → Export**
2. Under **S3 Export**, toggle it on
3. Enter your S3 bucket name, region, and credentials
4. Click **Save S3 Config**
Each export run writes a new NDJSON file to your bucket. Files are named with a timestamp so downstream consumers can process them in order.
### OTLP Log Export
Streams audit log entries as OpenTelemetry `LogRecord` objects to any OTLP-compatible collector — Datadog, Splunk, Grafana Loki, Honeycomb, and others.
**To configure:**
1. Go to **Settings → Audit Log → Export**
2. Under **OTLP Log Export**, toggle it on
3. Enter your OTLP endpoint URL and any required headers (e.g. `Authorization: Bearer `)
4. Click **Save OTLP Config**
Logs are batched and pushed on a recurring schedule. The endpoint must accept OTLP over HTTP.
## Metrics Export
Access from **Observability → Export** in the left sidebar.
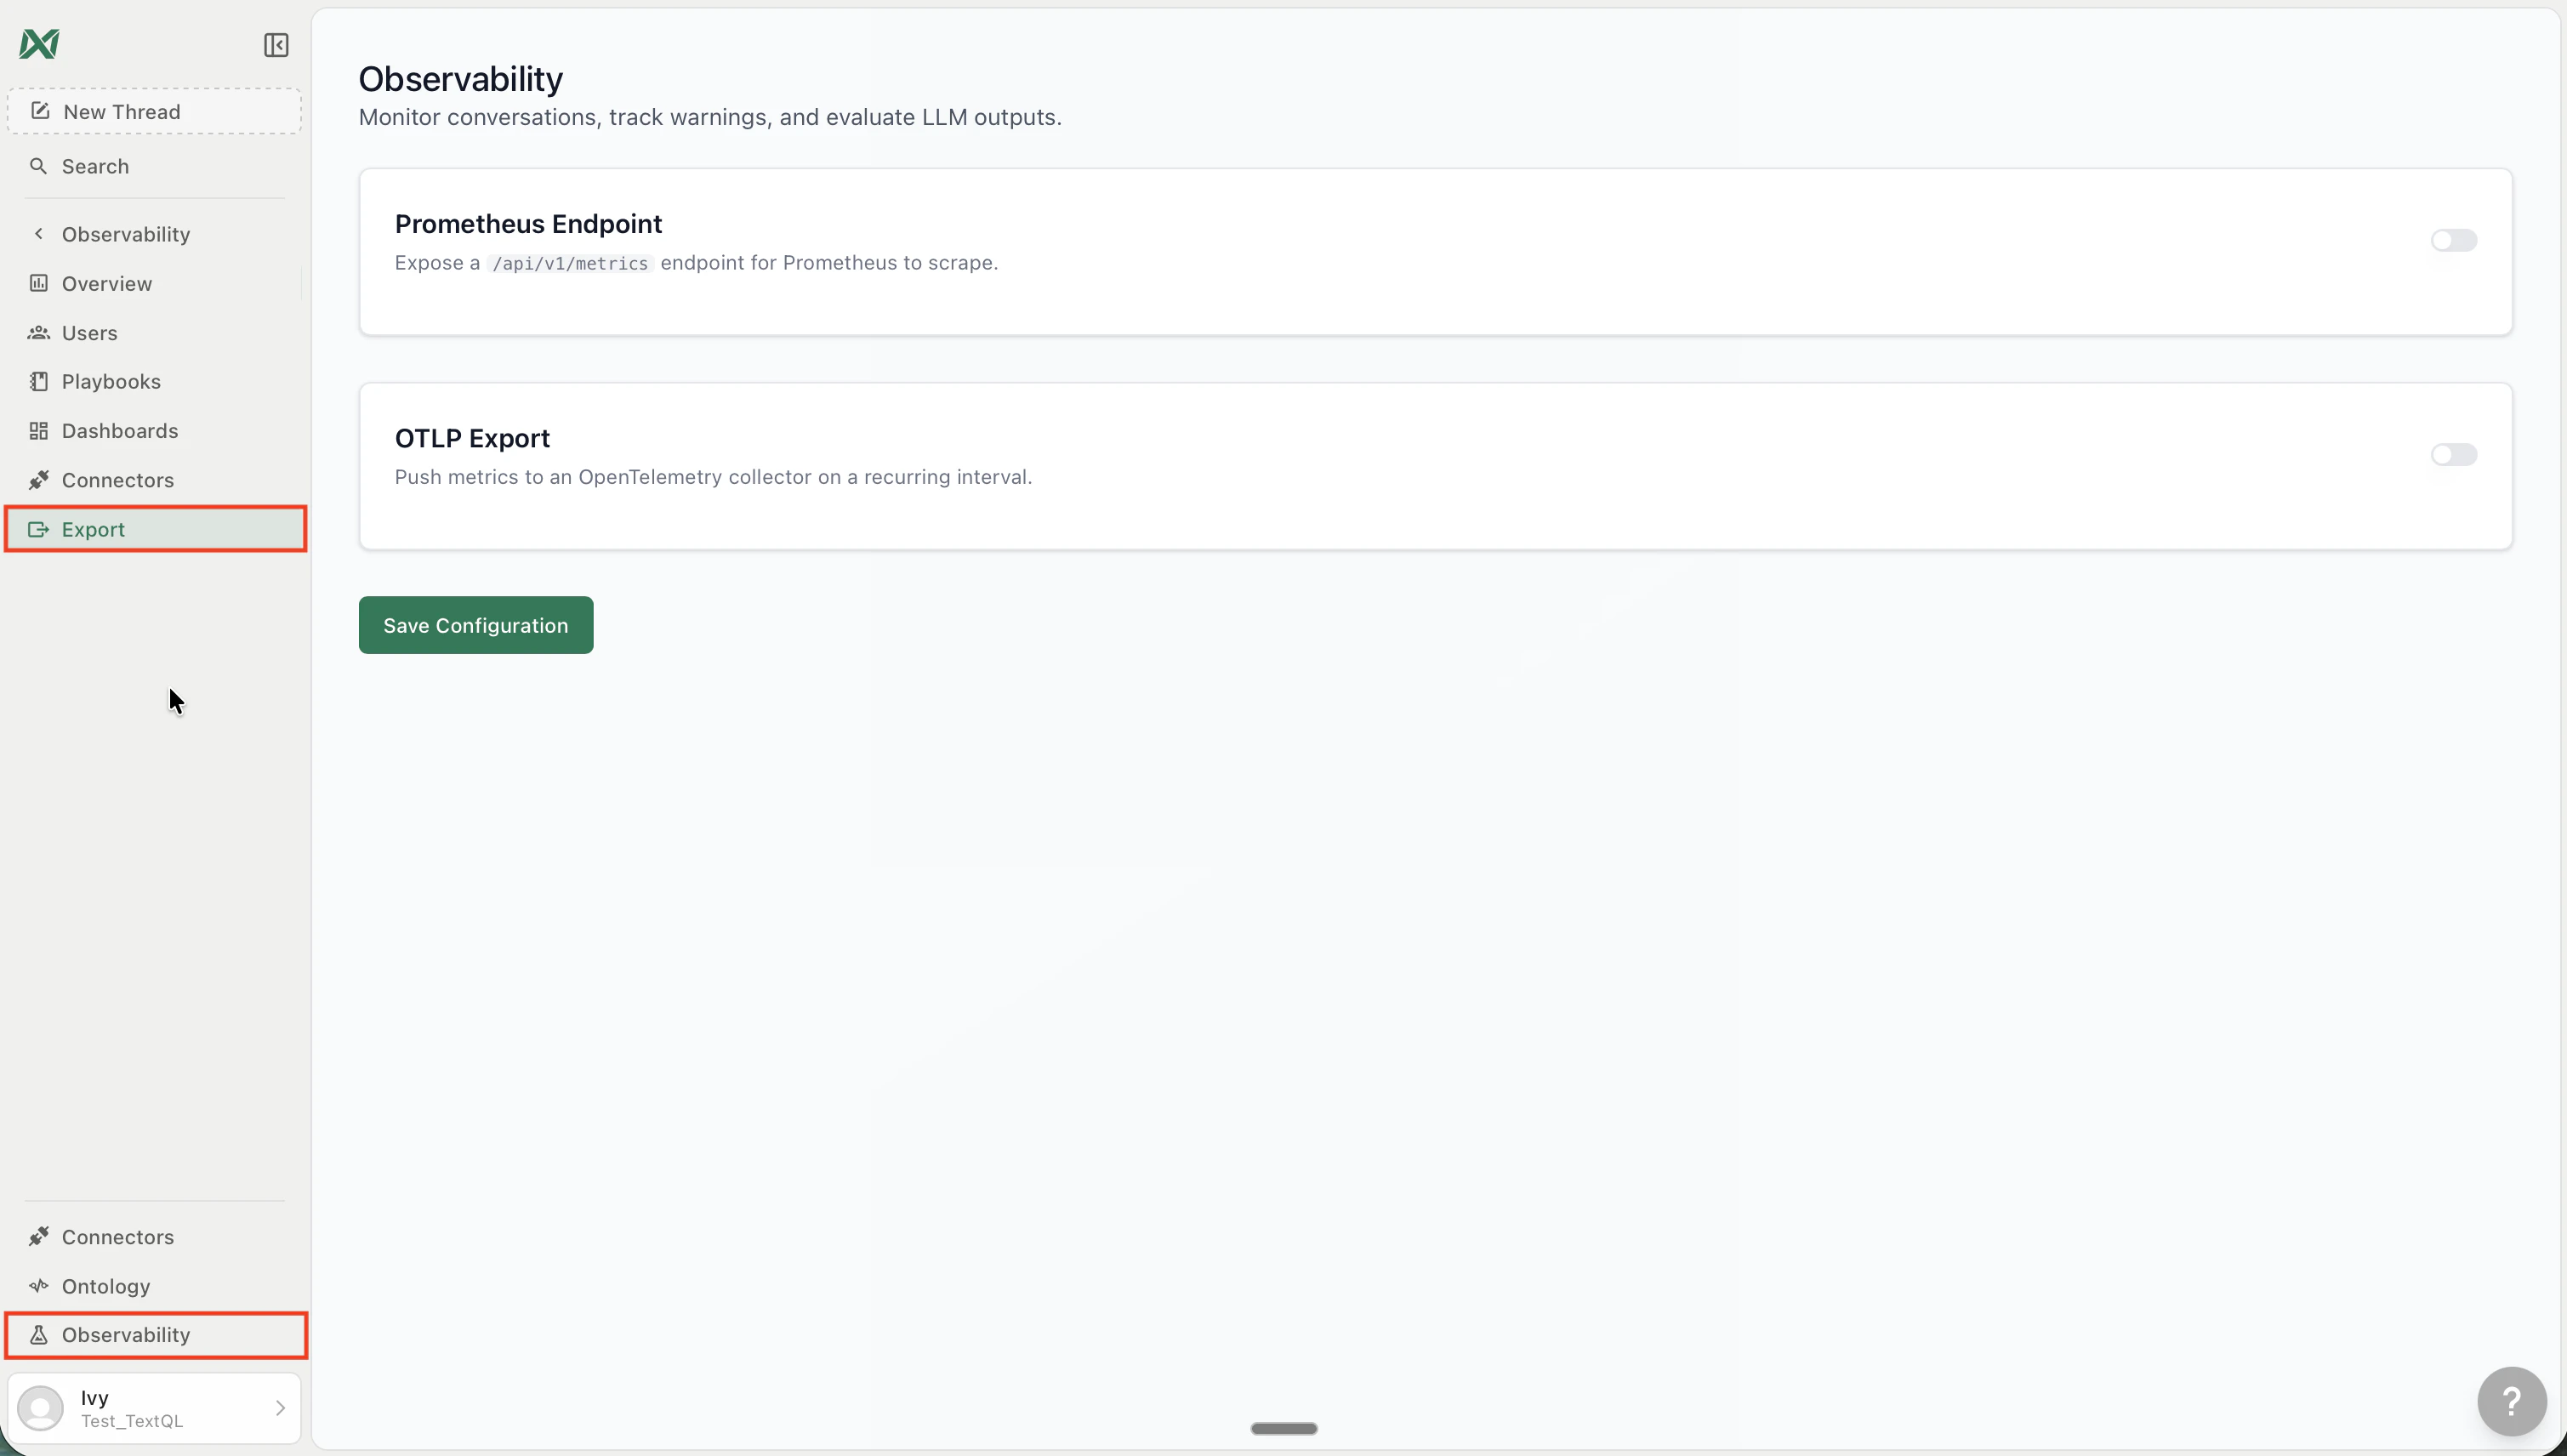 Product metrics cover usage, performance, and operational signals across your TextQL workspace. You can push them to an S3 bucket, via OpenTelemetry to any OTLP endpoint, or expose them as a Prometheus scrape target — all three are configurable independently.
### Prometheus Endpoint
Exposes a `/api/v1/metrics` scrape endpoint that Prometheus can pull from on its own schedule.
**To configure:**
1. Go to **Observability → Export**
2. Under **Prometheus Endpoint**, toggle it on
3. Click **Save Configuration**
4. Add TextQL as a scrape target in your Prometheus config:
```yaml theme={null}
scrape_configs:
- job_name: 'textql'
authorization:
credentials: ''
static_configs:
- targets: ['app.textql.com:443']
metrics_path: '/api/v1/metrics'
scheme: https
```
Once scraped, TextQL metrics flow into your existing Prometheus dashboards automatically.
### OTLP Export
Pushes product metrics to any OpenTelemetry-compatible collector on a recurring interval — Datadog, Grafana, Honeycomb, and others.
**To configure:**
1. Go to **Observability → Export**
2. Under **OTLP Export**, toggle it on
3. Enter your OTLP endpoint URL and any required headers
4. Click **Save Configuration**
Metrics are pushed via OTLP HTTP (JSON or protobuf). The interval is configurable per your org's needs.
## Compatible Tools
Both OTLP streams work with any collector that accepts the OpenTelemetry protocol over HTTP:
* **Datadog** — via the Datadog Agent OTLP ingest
* **Grafana** — Loki (logs), Mimir or Prometheus (metrics)
* **Splunk** — via the Splunk OpenTelemetry Collector
* **Honeycomb** — native OTLP ingest
* **Any OpenTelemetry Collector** — forward to your existing pipeline
## Further Reading
* [Audit Log](/core/admin/audit-log) — what actions are captured and how to browse them in-app
* [Observability](/core/admin/observability) — retrospective thread quality monitoring and warning analysis
Product metrics cover usage, performance, and operational signals across your TextQL workspace. You can push them to an S3 bucket, via OpenTelemetry to any OTLP endpoint, or expose them as a Prometheus scrape target — all three are configurable independently.
### Prometheus Endpoint
Exposes a `/api/v1/metrics` scrape endpoint that Prometheus can pull from on its own schedule.
**To configure:**
1. Go to **Observability → Export**
2. Under **Prometheus Endpoint**, toggle it on
3. Click **Save Configuration**
4. Add TextQL as a scrape target in your Prometheus config:
```yaml theme={null}
scrape_configs:
- job_name: 'textql'
authorization:
credentials: ''
static_configs:
- targets: ['app.textql.com:443']
metrics_path: '/api/v1/metrics'
scheme: https
```
Once scraped, TextQL metrics flow into your existing Prometheus dashboards automatically.
### OTLP Export
Pushes product metrics to any OpenTelemetry-compatible collector on a recurring interval — Datadog, Grafana, Honeycomb, and others.
**To configure:**
1. Go to **Observability → Export**
2. Under **OTLP Export**, toggle it on
3. Enter your OTLP endpoint URL and any required headers
4. Click **Save Configuration**
Metrics are pushed via OTLP HTTP (JSON or protobuf). The interval is configurable per your org's needs.
## Compatible Tools
Both OTLP streams work with any collector that accepts the OpenTelemetry protocol over HTTP:
* **Datadog** — via the Datadog Agent OTLP ingest
* **Grafana** — Loki (logs), Mimir or Prometheus (metrics)
* **Splunk** — via the Splunk OpenTelemetry Collector
* **Honeycomb** — native OTLP ingest
* **Any OpenTelemetry Collector** — forward to your existing pipeline
## Further Reading
* [Audit Log](/core/admin/audit-log) — what actions are captured and how to browse them in-app
* [Observability](/core/admin/observability) — retrospective thread quality monitoring and warning analysis