> ## Documentation Index
> Fetch the complete documentation index at: https://docs.textql.com/llms.txt
> Use this file to discover all available pages before exploring further.
# Sample Conglomerate Ontology
> TextQL's Sample Conglomerate Ontology
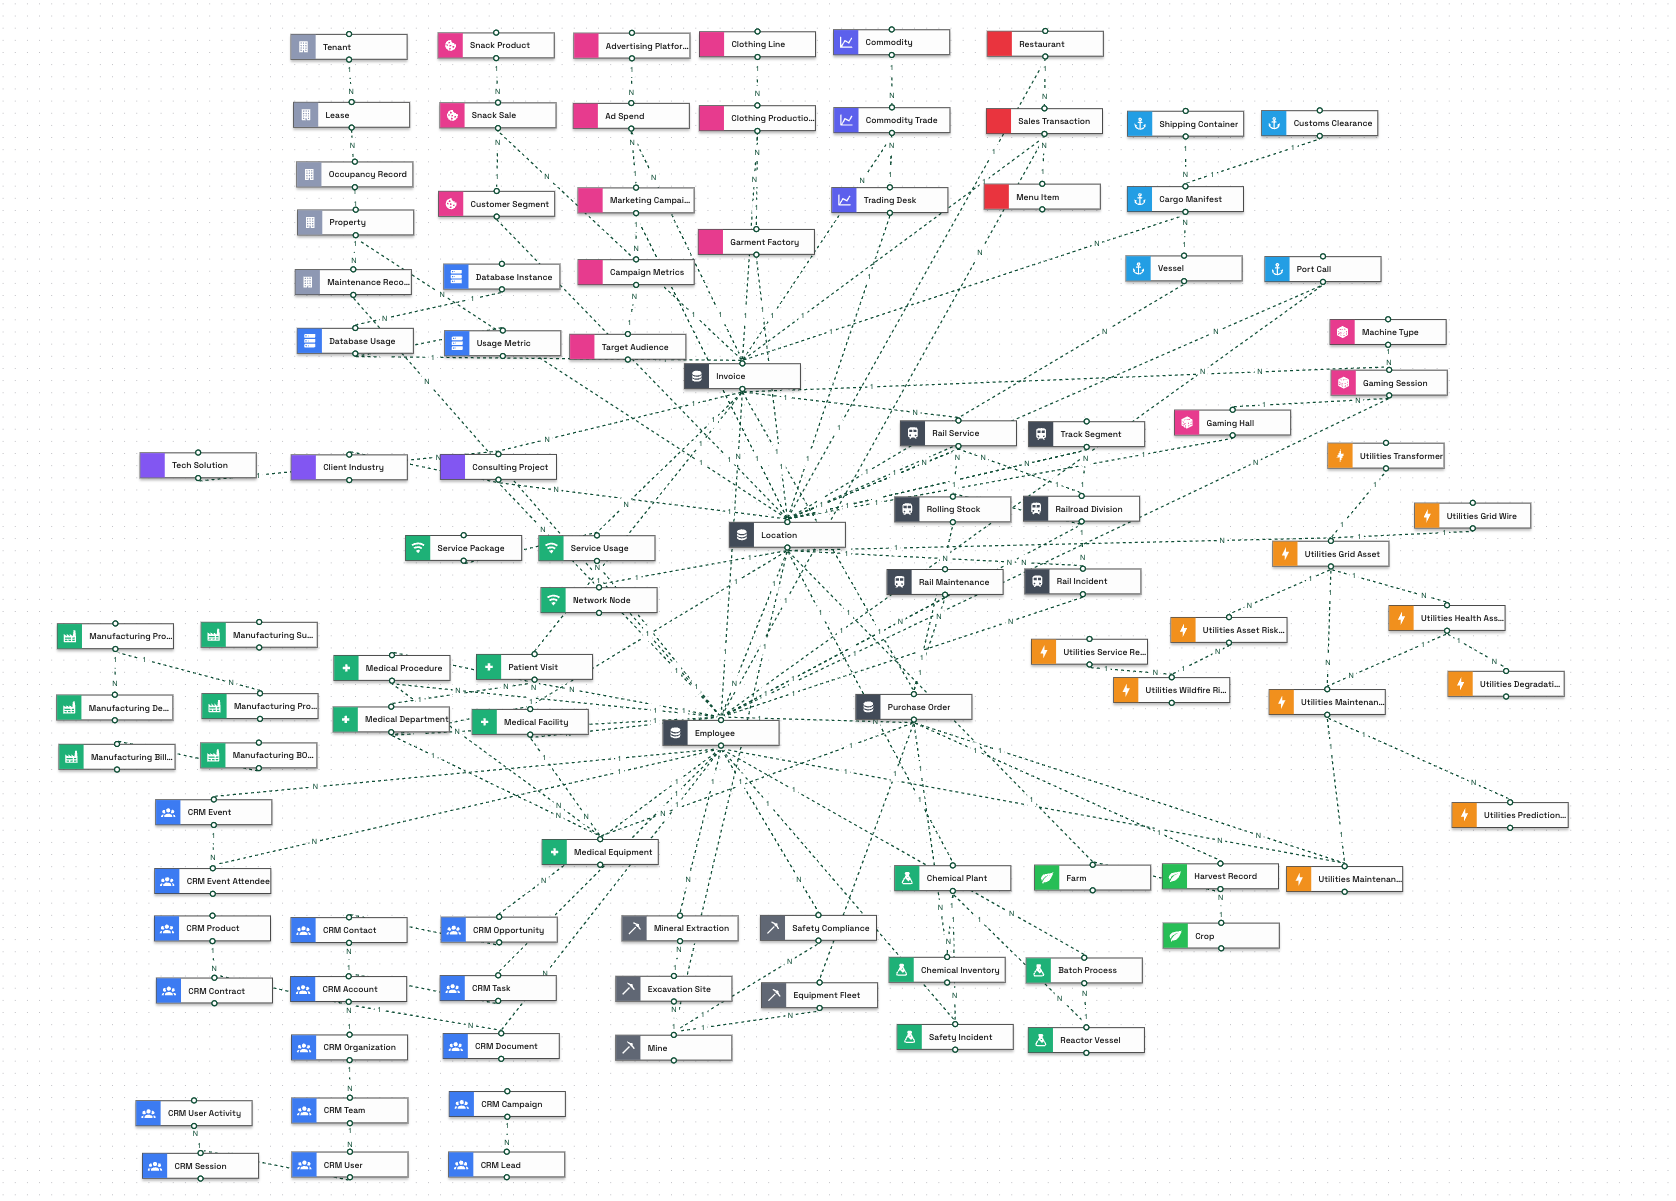 The **TextQL Conglomerate Ontology** is a free-to-use sample ontology populated with synthetic data. It includes over 100 objects and offers an excellent way to learn how to use Ana or to see her in action quickly within a large-scale data warehouse.
In this document, we'll explore the contents of the sample ontology and initiate a few sample chats.
TextQL is working to establish a public environment where prospective customers can interact with the TextQL Conglomerate Ontology on their own. If you or your organization would like access to the Conglomerate Ontology in the meantime, please contact [support@textql.com](mailto:support@textql.com).
## Dataset Description
The **TextQL Conglomerate Ontology** comprises over 100 objects, organized into 12 distinct domains (such as Digital Marketing, Garment Manufacturing, Snack Sales (CPG), etc.). Each domain contains between 3 and 10 objects, tailored to represent specific business areas and data sources.
At the heart of the ontology lie four **Core Objects** that are shared across all domains and enable cross-domain analysis:
* **Location**: Basic geographical information for all other entities
* **Employee**: Staff records with roles and salaries
* **Purchase Order**: Tracks outgoing and incoming purchases
* **Invoice**: Financial records linked to various transactions
Links to the core objects, as well as connections between other domains, facilitate cross-domain analysis and the study of cross-domain metrics such as:
* Employee salary trends by role and location
* Invoice amounts and frequency by business unit
* Geographic distribution of operations
## Subsidiary Domains and Data
### Commodities Trading
* TradingDesk: Regional trading operations offices
* Commodity: Traded materials (e.g., Crude Oil, Natural Gas, Gold)
* CommodityTrade: Individual trading transactions
* Trading volume by commodity type
* Price trends over time
* Performance by trading desk
* Regional trading patterns
* Asian desks (Tokyo, Singapore) show increasing trade volume
* Western desks (London, NY) show decreasing volume
* Overall prices trend upward with seasonal variations
* How does trading volume vary between Asian and Western desks over time?
* What are the seasonal patterns in commodity prices?
* Which commodities show the strongest growth in trading volume?
The **TextQL Conglomerate Ontology** is a free-to-use sample ontology populated with synthetic data. It includes over 100 objects and offers an excellent way to learn how to use Ana or to see her in action quickly within a large-scale data warehouse.
In this document, we'll explore the contents of the sample ontology and initiate a few sample chats.
TextQL is working to establish a public environment where prospective customers can interact with the TextQL Conglomerate Ontology on their own. If you or your organization would like access to the Conglomerate Ontology in the meantime, please contact [support@textql.com](mailto:support@textql.com).
## Dataset Description
The **TextQL Conglomerate Ontology** comprises over 100 objects, organized into 12 distinct domains (such as Digital Marketing, Garment Manufacturing, Snack Sales (CPG), etc.). Each domain contains between 3 and 10 objects, tailored to represent specific business areas and data sources.
At the heart of the ontology lie four **Core Objects** that are shared across all domains and enable cross-domain analysis:
* **Location**: Basic geographical information for all other entities
* **Employee**: Staff records with roles and salaries
* **Purchase Order**: Tracks outgoing and incoming purchases
* **Invoice**: Financial records linked to various transactions
Links to the core objects, as well as connections between other domains, facilitate cross-domain analysis and the study of cross-domain metrics such as:
* Employee salary trends by role and location
* Invoice amounts and frequency by business unit
* Geographic distribution of operations
## Subsidiary Domains and Data
### Commodities Trading
* TradingDesk: Regional trading operations offices
* Commodity: Traded materials (e.g., Crude Oil, Natural Gas, Gold)
* CommodityTrade: Individual trading transactions
* Trading volume by commodity type
* Price trends over time
* Performance by trading desk
* Regional trading patterns
* Asian desks (Tokyo, Singapore) show increasing trade volume
* Western desks (London, NY) show decreasing volume
* Overall prices trend upward with seasonal variations
* How does trading volume vary between Asian and Western desks over time?
* What are the seasonal patterns in commodity prices?
* Which commodities show the strongest growth in trading volume?
### Digital Marketing
* MarketingCampaign: Marketing initiatives
* AdvertisingPlatform: Ad platforms (Google, Meta, etc.)
* TargetAudience: Demographic segments
* AdSpend: Advertising expenditure
* CampaignMetrics: Performance metrics
* ROI by platform and campaign
* Audience engagement rates
* Spend efficiency
* Conversion rates
* Digital-first domains (Gaming, CRM) show increasing spend and engagement
* Traditional domains (Manufacturing, Real Estate) show decreasing metrics
* Seasonal spikes during holidays/events
* How does ROI compare between digital-first and traditional domains?
* What are the seasonal patterns in ad performance?
* Which platforms show the best performance for different audience segments?
### Communications Provider
* NetworkNode: Physical infrastructure
* ServicePackage: Service offerings
* ServiceUsage: Usage metrics and quality
* Network quality scores
* Bandwidth utilization
* Service reliability
* Customer usage patterns
* Northern regions show more weather impact on service quality
* Peak hour usage patterns
* Service quality varies by region and weather conditions
* Enterprise customers increasingly choose higher tiers
* How does weather impact service quality across regions?
* What are the peak usage patterns by region?
* How has enterprise tier adoption changed over time?
### Cloud Database Usage
* DatabaseInstance: Cloud databases
* UsageMetric: Usage measurements
* DatabaseUsage: Actual usage records
* Storage utilization
* Read/write operations
* Cost per operation
* Usage patterns by domain
* Gaming & CRM showing rapid growth
* Manufacturing optimizing and reducing costs
* Others growing steadily
* Which domains show the highest growth in database usage?
* How do cost optimization efforts impact usage patterns?
* What are the peak usage times by domain?
### Gaming Operations
* GamingHall: Physical gaming locations
* MachineType: Gaming equipment types
* GamingSession: Individual play sessions
* Revenue by location and machine type
* Session duration
* Machine utilization
* Customer demographics
* Evening hours becoming more popular
* Modern locations growing faster
* Traditional locations stable/declining
* How do modern vs traditional locations compare in growth?
* What are the peak playing hours and how have they evolved?
* Which machine types show the highest profitability?
### Garment Manufacturing
* GarmentFactory: Production facilities
* ClothingLine: Product collections
* ClothingProductionBatch: Production runs
* Production volume
* Defect rates
* Efficiency by factory
* Cost per unit
* USA production gradually increasing (reshoring)
* Asia production slowly decreasing
* Overall quality improving over time
* How has production shifted between regions?
* What are the quality improvement trends by region?
* How do production costs compare between regions?
### Snack Sales (CPG)
* SnackProduct: Product catalog
* CustomerSegment: Consumer demographics
* SnackSale: Sales transactions
* Sales by product and segment
* Revenue trends
* Demographic preferences
* Seasonal patterns
* Young adult products increasingly popular with 18-24 age range
* Family products stable across demographics
* Seasonal variations in sales
* How do different age groups respond to product types?
* What are the seasonal sales patterns by product?
* Which demographic segments show the strongest growth?
### Utilities
* Service Region: Geographic regions of service coverage
* Wildfire Risk Zone: Areas monitored for fire risk
* Grid Asset: Base infrastructure (transformers, wires, etc.)
* Transformer: Specialized power transformer equipment
* Grid Wire: Power line infrastructure
* Asset Risk Zone: Maps assets to risk zones
* Health Assessment: Equipment health checks
* Degradation Factor: Issues found in health checks
* Maintenance Prediction: Predicted maintenance needs
* Prediction Risk Factor: Risk factors for predictions
* Maintenance Order: Work orders for maintenance
* Asset health scores by region and climate type
* Risk zone distributions
* Maintenance prediction accuracy
* Asset age vs. performance
* Regional maintenance patterns
* Desert regions show higher wildfire risk
* Winter months specifically impact wire performance due to storms
* Transformers concentrated in desert areas
* Wire infrastructure concentrated in mountain areas
* Asset health scores decrease with age
* Desert transformers show accelerated degradation in summer
* Compare wildfire risk zones between desert regions and other climates
* How does the concentration of transformers vs wires differ between desert and mountain regions?
* What's the seasonal pattern of risk levels, particularly in summer months?
* Analyze asset health scores by age group - do older assets consistently perform worse?
* Is there a correlation between winter months and wire-related issues?
* Do desert transformers show faster degradation rates during summer months?
* How do maintenance patterns align with California's geographic regions?
### Healthcare Operations
* MedicalFacility: Hospitals, clinics, labs, and pharmacies
* Department: Organizational units within facilities
* MedicalEquipment: Medical devices and tools
* PatientVisit: Patient encounters and visits
* Procedure: Medical procedures performed
* Facility utilization (bed count, equipment usage)
* Procedure costs and durations
* Visit volumes by department
* Equipment maintenance status
* Hospitals show higher bed utilization than clinics
* Equipment maintenance patterns vary by type
* Visit priorities show expected distribution (more routine, fewer critical)
* How does facility utilization vary by type and region?
* What are the patterns in procedure costs across facilities?
* How do equipment maintenance cycles affect procedure scheduling?
### Railroad Operations
* RailroadDivision: Operational divisions (Freight/Passenger)
* RollingStock: Trains and cars
* TrackSegment: Rail infrastructure
* RailService: Scheduled services
* RailMaintenance: Maintenance records
* RailIncident: Safety and operational incidents
* Track utilization and condition
* Service revenue and punctuality
* Maintenance costs and frequency
* Incident rates and severity
* Passenger services show higher frequency but lower revenue
* Maintenance costs increase with track age
* Weather impacts vary by region
* Safety incidents correlate with maintenance patterns
* How do passenger vs freight services compare in profitability?
* What are the maintenance patterns across different track segments?
* How do weather conditions impact service reliability?
### B2B SaaS CRM (Customer Relationship Management)
* CrmOrganization: Parent companies and partners (with type, size, location)
* CrmAccount: Business units within organizations (with tier, revenue, industry)
* CrmContact: Individual stakeholders (with role, level, decision-making power)
* CrmContract: Legal agreements and renewals
* CrmCampaign: Marketing initiatives and programs
* CrmEvent: Customer meetings, trainings, and conferences
* CrmEventAttendee: Event participation tracking
* CrmDocument: Contracts, proposals, and legal documents (with versions, formats)
* CrmLead: Potential sales opportunities
* CrmOpportunity: Sales pipeline tracking
* CrmProduct: Product catalog and pricing
* CrmTeam: Internal organizational units
* CrmUser: System users and their activities
* CrmUserActivity: Detailed user interaction logs
* CrmSession: User login sessions
* CrmTask: Work items and assignments
* Contract value and renewal rates
* Campaign ROI and lead conversion
* Account engagement levels
* Sales cycle duration
* Team performance metrics
* Document processing time
* System usage patterns
* Lead qualification rates
* Opportunity conversion rates
* Product adoption rates
* User activity duration
* Task completion rates
* Event attendance rates
* Enterprise accounts show higher contract values but longer sales cycles
* Mid-market segment growing fastest with shorter cycles
* Virtual events gaining higher attendance than in-person
* Document processing slows during end-of-quarter peaks
* User adoption varies significantly by team
* Lead quality varies by source and campaign
* Product mix differs by account tier
* Session patterns indicate peak usage times
* How do sales cycles and success rates vary by account tier?
* What engagement patterns predict successful renewals?
* Which campaign types show best ROI by industry?
* How does team structure impact sales performance?
* What user activity patterns correlate with successful sales?
* Which lead sources produce highest quality opportunities?
* How does product adoption vary by account type?
* What event types drive the most opportunity progression?
### Furniture Manufacturing & Retail System
* FurnitureProduct: Products with categories, descriptions, and pricing
* FurnitureBillOfMaterials: Manufacturing recipes and component structures
* FurnitureSupply: Raw materials and supplies used in manufacturing
* FurnitureBomComponent: Components used in product assembly
* FurnitureProductBomComponent: Product-based assembly components with quantities
* FurnitureSupplyBomComponent: Supply-based components with quantities
* FurnitureOrder: Customer orders with channel and timing information
* FurnitureProductOrder: Product-specific order details with quantities
* FurnitureDemandPlan: Production planning and forecasting
* Average product list price (from FurnitureProduct)
* Sum of product quantities in BOMs (from FurnitureProductBomComponent)
* Sum of supply quantities in BOMs (from FurnitureSupplyBomComponent)
* Distinct order count (from FurnitureOrder)
* Sum of ordered product quantities (from FurnitureProductOrder)
* Sum of demand plan quantities (from FurnitureDemandPlan)
* Web channel adoption increasing over time
* Product pricing sensitivity varies by category
* Demand planning shows seasonal patterns
* Order quantities follow price-sensitive patterns
* How do furniture component costs impact final product pricing?
* How do BOM revisions vary in terms of requirements by quantity over time?
* What supply chain patterns emerge across different furniture product categories?
* How does web vs marketplace channel performance compare for furniture sales?
* What factors drive demand plan accuracy?
* Which furniture product categories show strongest seasonal patterns?