> ## Documentation Index
> Fetch the complete documentation index at: https://docs.textql.com/llms.txt
> Use this file to discover all available pages before exploring further.

# Module 0 · Setup & Orientation

> Confirm these five things now, so you don’t stall at minute ten: (1) your login works; (2) you can see New Thread; (3) at least one connector appears under the "+" menu; (4) a t… (~10 min)

<Warning>
  **Before you start — the 2-minute gate** —

  Confirm these five things now, so you don't stall at minute ten: (1) your login works; (2) you can see **New Thread**; (3) at least one **connector** appears under the "+" menu; (4) a test question ("how many rows in our main table?") returns an answer; (5) if any of these fail — stop and ask your workspace admin or TextQL contact *before* investing time. Everything past this point assumes a working, connected workspace.
</Warning>

## 0.1 · Sign in and start a thread

* Open your TextQL workspace (typically `app.textql.com` or your company's dedicated URL) and sign in.
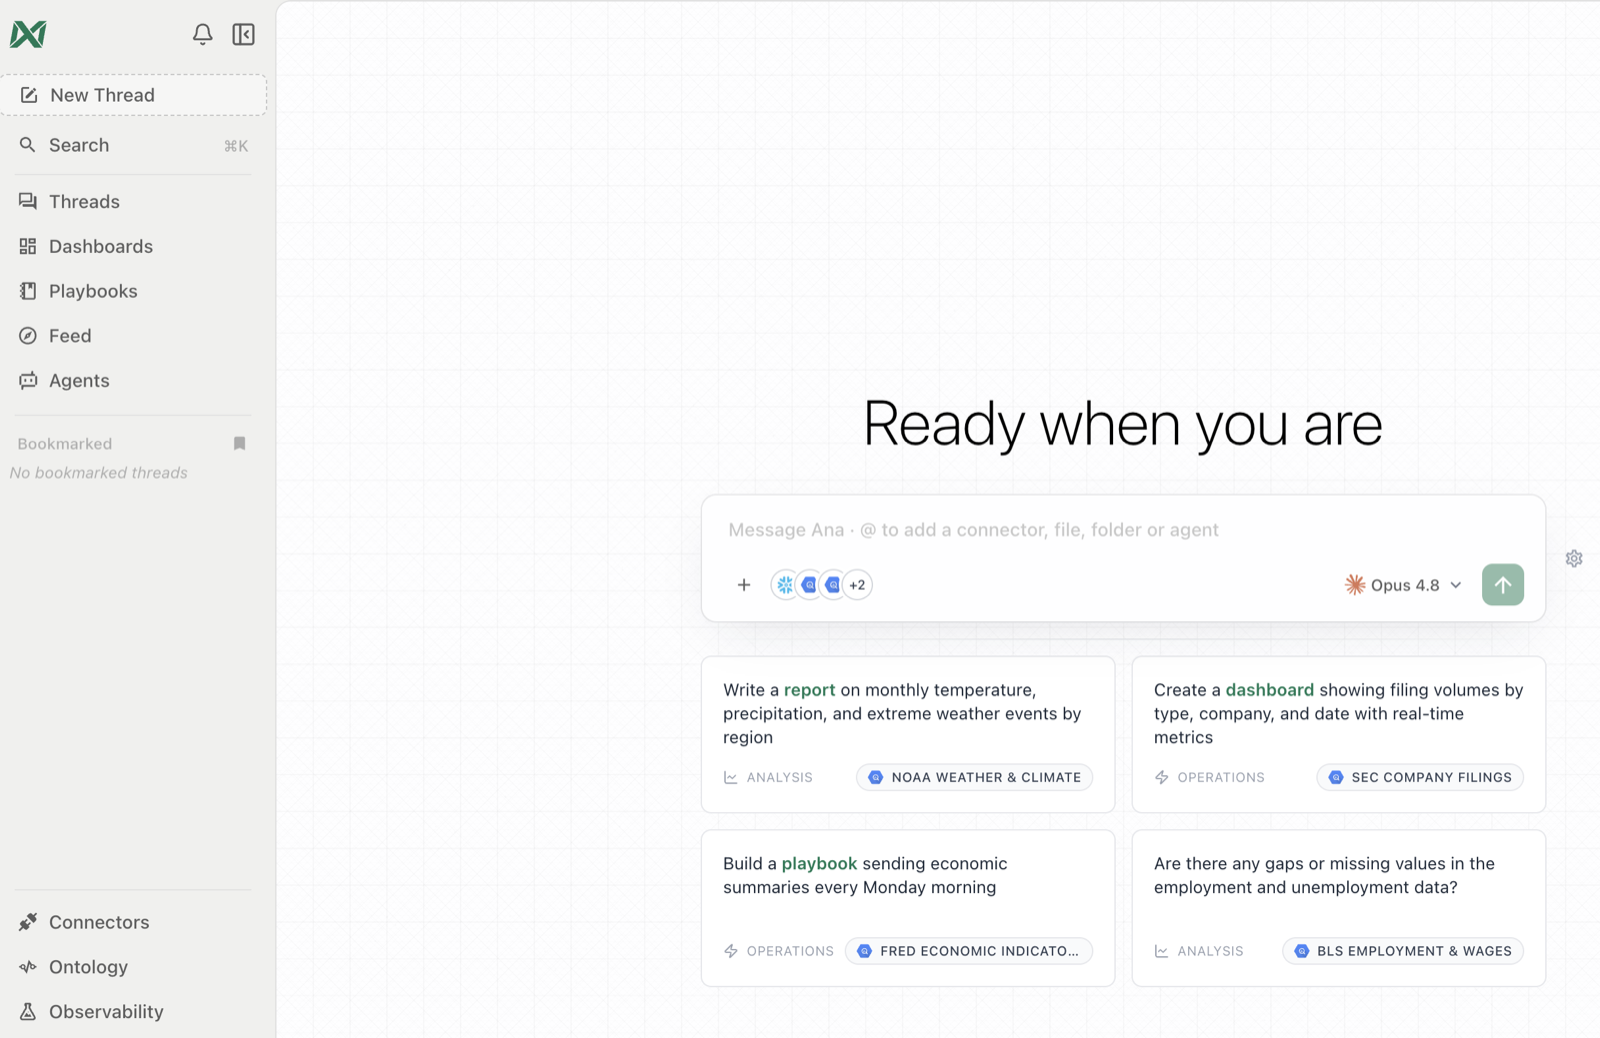
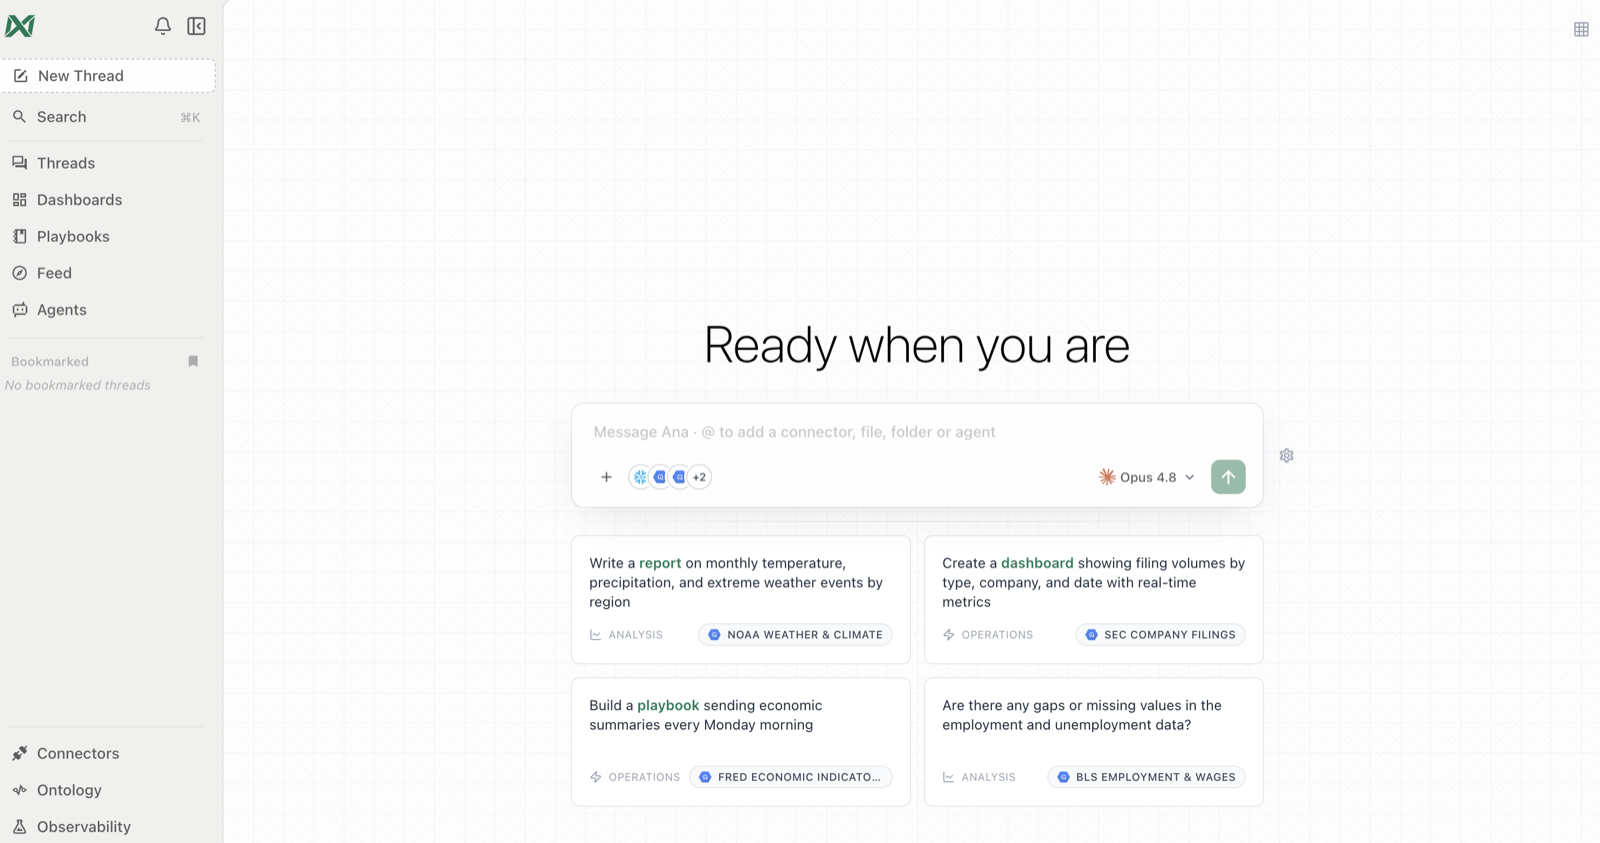
* Click **New Thread** in the sidebar. Each thread is a self-contained conversation with Ana.

<Frame caption="Starting a new thread from the sidebar.">
  <img src="https://textqllabs.github.io/workshops/self-service-analytics/assets/m0-new-thread.png" alt="Starting a new thread" />
</Frame>

## 0.2 · Attach a data source

Before sending your first message, click the **"+" button** at the bottom-left of the chat input:

* **Connectors** — select the database(s) your team uses. Missing one? Ask your admin (Connectors page).
* **Tools** — make sure **Text to SQL** and **Ontology** are on.
* **Output format** — leave on **Chat** for this workshop.
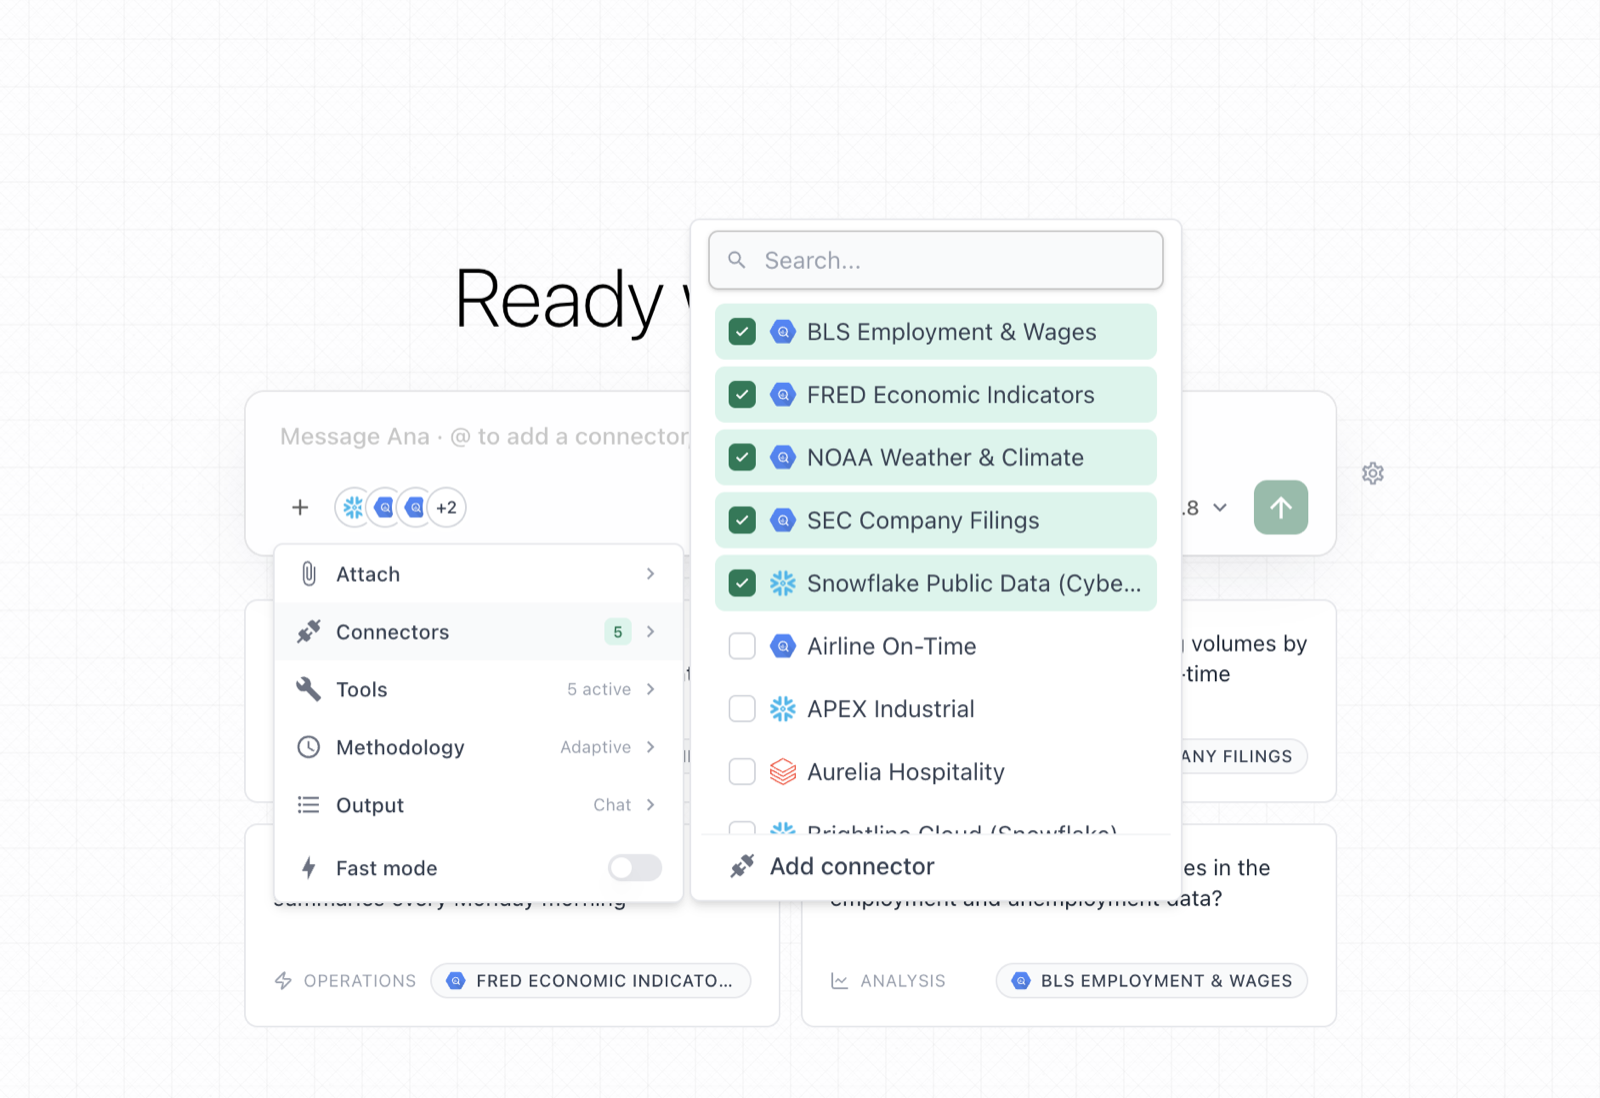
<Frame caption="Attach connectors and tools via the '+' menu — before the first message.">
  <img src="https://textqllabs.github.io/workshops/self-service-analytics/assets/m0-attach-connector.png" alt="Attaching a connector via the + menu" />
</Frame>

<Warning>
  **Heads up** —

  Connectors and tools are chosen **before the first message** of a thread. To change them later, start a new thread.
</Warning>

<Accordion title="The demo dataset — guaranteed answers for every question in this guide">
  Running this as a demo, a guided session, or solo without your own data? Use the **TextQL demo connectors** — public datasets (SEC Company Filings, BLS Employment & Wages, FRED Economic Indicators, NOAA Weather & Climate) available in demo workspaces — and every pattern in this guide resolves cleanly. Swap the bracketed examples like this:

  <table>
    <tr><th>Guide prompt</th><th>Demo-dataset version</th></tr>
    <tr><td>Baseline control (0.5)</td><td>"How many companies are in the SEC filings data?"</td></tr>
    <tr><td>First question (1.1)</td><td>"How many SEC filings were submitted last month? How does that compare to the month before?"</td></tr>
    <tr><td>Break it down (2.1)</td><td>"Break that down by filing type — show the top 5."</td></tr>
    <tr><td>The "why" (2.4)</td><td>"Which filing types drove the change? Dig one level deeper."</td></tr>
    <tr><td>Chart (3.1)</td><td>"Show me quarterly revenue for the 5 most profitable companies as a chart."</td></tr>
    <tr><td>Trust (4.1)</td><td>"How did you define 'most profitable'? Walk me through it."</td></tr>
    <tr><td>Cross-source (3.6)</td><td>"Is there a relationship between unemployment (BLS) and SEC filing volume over the last two years?"</td></tr>
    <tr><td>Playbook (5.1)</td><td>"Create a playbook: every Monday 9am, summarize last week's SEC filings by type and flag anything unusual. Email it to me."</td></tr>
  </table>

  Facilitators: pre-run these once in the demo workspace the day before — the screenshots in this guide were captured against exactly this dataset, so what attendees see matches the pictures.
</Accordion>

<Note>
  **No data connected yet?** —

  You need at least one connected data source for this workshop. If your workspace shows no connectors: **ask your workspace admin or TextQL contact** — they can connect a source or provision a **demo workspace with sample data** in minutes. (If you ARE the admin, the [Connect Your Data](/workshops/connect-your-data/overview) workshop covers every source type step by step.)
</Note>

## 0.3 · Orientation — what's where

<table>
  <tr><th>Sidebar item</th><th>What it is</th></tr>
  <tr><td>**Threads**</td><td>Your past conversations — every analysis is saved and shareable</td></tr>
  <tr><td>**Dashboards**</td><td>Live, interactive dashboards you or teammates published</td></tr>
  <tr><td>**Playbooks**</td><td>Scheduled analyses delivered to email/Slack</td></tr>
  <tr><td>**Connectors**</td><td>The databases and APIs your org has plugged in</td></tr>
  <tr><td>**Ontology**</td><td>Your org's governed definitions — metrics, terms, business logic</td></tr>
  <tr><td>**Context Library**</td><td>Reference docs Ana reads to understand your business</td></tr>
</table>

<Frame caption="The lay of the land: Threads, Dashboards, Playbooks, Connectors, Ontology, Context Library.">
  <img src="https://textqllabs.github.io/workshops/self-service-analytics/assets/m0-sidebar-tour.png" alt="The TextQL sidebar" />
</Frame>

## 0.4 · Say hello

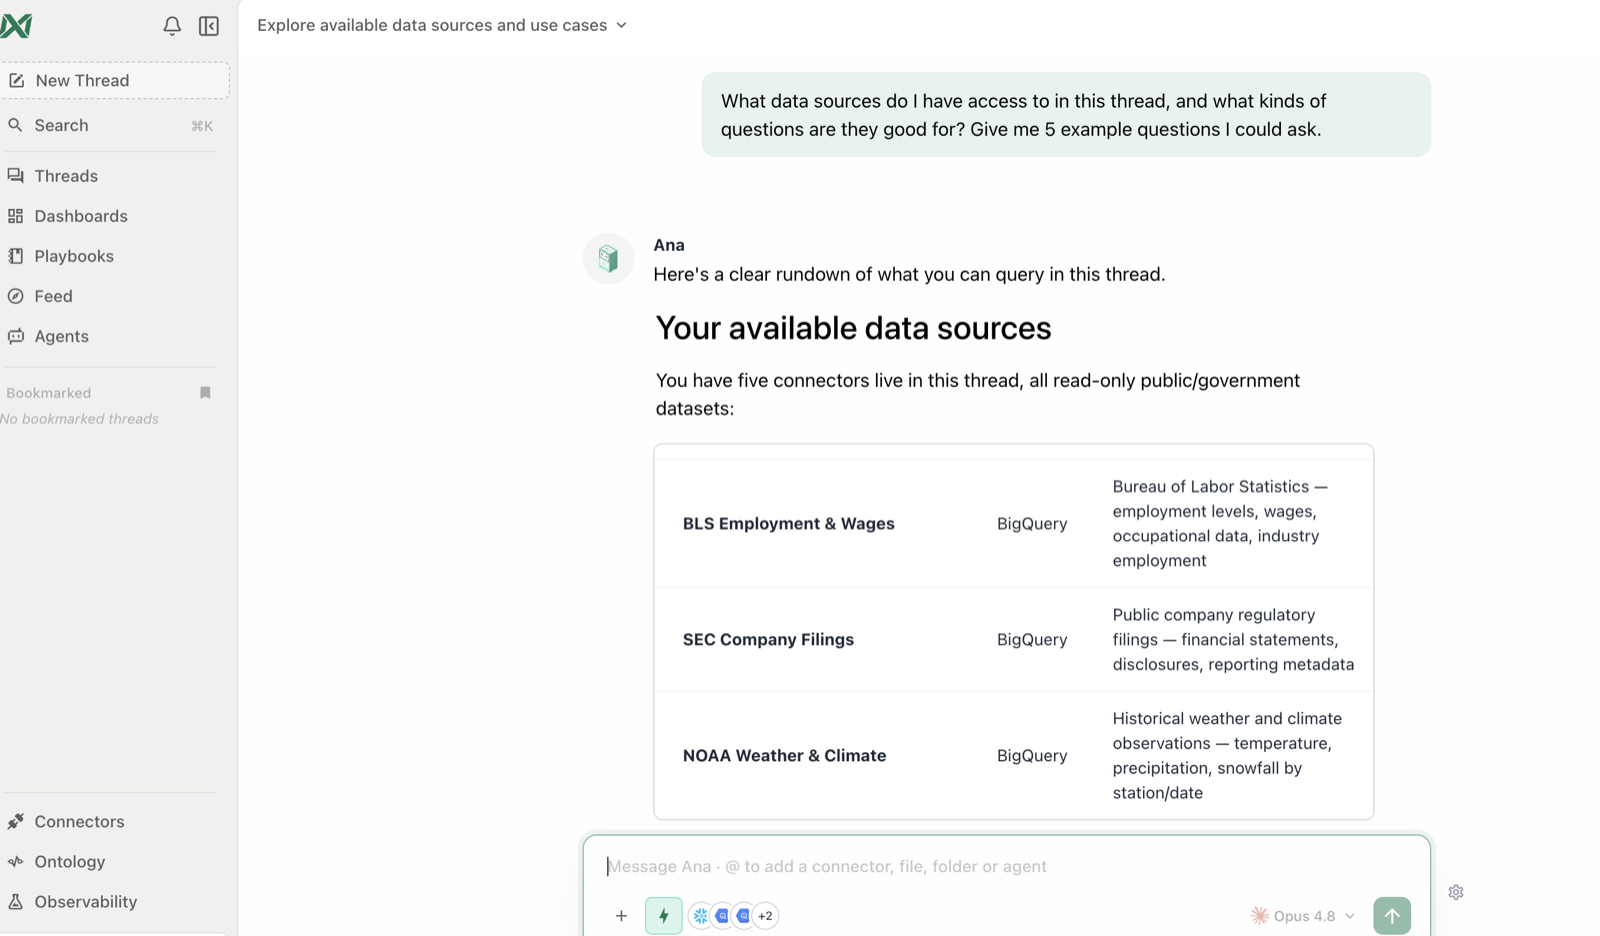
```text Prompt theme={null}
What data sources do I have access to in this thread, and what kinds of questions are they good for? Give me 5 example questions I could ask.
```
<Check>
  **You'll see:** Ana lists the attached connectors, summarizes what's in them, and suggests starter questions tailored to your actual data.
</Check>

<Frame caption="Ana's tour of your data — keep her suggested questions handy for Module 1.">
  <img src="https://textqllabs.github.io/workshops/self-service-analytics/assets/m0-hello.png" alt="Ana describing available data sources" />
</Frame>

## 0.5 · Baseline check — three test questions

Before learning anything, benchmark your workspace. Ask these three and **write down the answers and how long each took** — you'll compare against them at the end of the workshop:

```text Prompt theme={null}
How many [customers / members / orders] do we have in total?
```

<Check>
  **You'll see:** a simple count — both you and Ana should find this easy. If this fails, something's wrong with the connection: see Troubleshooting below.
</Check>

```text Prompt theme={null}
What was [your main metric] last month, and how does it compare to the month before?
```

```text Prompt theme={null}
[A question your team genuinely disagrees about or that takes an analyst a day — e.g. "What's our true customer churn rate this quarter?"] Tell me which definition you used.
```

<Check>
  **You'll see:** the hard one is your **baseline**. Note the number AND the definition Ana assumed. By the wrap-up — after you've learned to refine, verify, and govern definitions — re-ask it and compare. That before/after is the whole point of the workshop.
</Check>

## Troubleshooting

<table>
  <tr><th>Symptom</th><th>Fix</th></tr>
  <tr><td>No connectors listed under "+"</td><td>Ask your org admin to grant access on the Connectors page</td></tr>
  <tr><td>Ana can't see a data source</td><td>It wasn't attached before the first message — start a new thread and attach it first</td></tr>
  <tr><td>Suggested questions look wrong for your team</td><td>That's fine — Module 6 covers teaching the platform your context</td></tr>
</table>

### ✅ Checkpoint

* [ ] You have a thread open with at least one connector attached
* [ ] Ana answered the hello prompt with a real description of your data
* [ ] You can see Threads, Dashboards, and Playbooks in the sidebar
* [ ] You ran the three baseline questions and noted the answers (especially the hard one's definition)