> ## Documentation Index
> Fetch the complete documentation index at: https://docs.textql.com/llms.txt
> Use this file to discover all available pages before exploring further.

# Module 4 · From Answers to Assets

> Every thread has a shareable link — your analysis, charts, and the audit trail, in one place. Open a Module 3 thread, use the share option, and send it to a teammate. (~30 min)

## 4.1 · Share the thread itself

Every thread has a shareable link — your analysis, charts, and the audit trail, in one place. Open a Module 3 thread, use the share option, and send it to a teammate.

<Note>
  **Sharing > screenshotting** —

  A shared thread keeps the context and the "show your work" trail attached to the number. A screenshot strips all of that away. When a decision rides on the number, share the thread.
</Note>

## 4.2 · Generate a polished report

```text Prompt theme={null}
Turn this analysis into a polished report: an executive summary up top, then the key charts with one-paragraph takeaways each, then a methodology appendix. Make it something I can send to my VP.
```

<Check>
  **You'll see:** a structured report assembled from the thread. Ask for a PDF or a slide deck version if you need a specific format.
</Check>

## 4.3 · Build a live dashboard

```text Prompt theme={null}
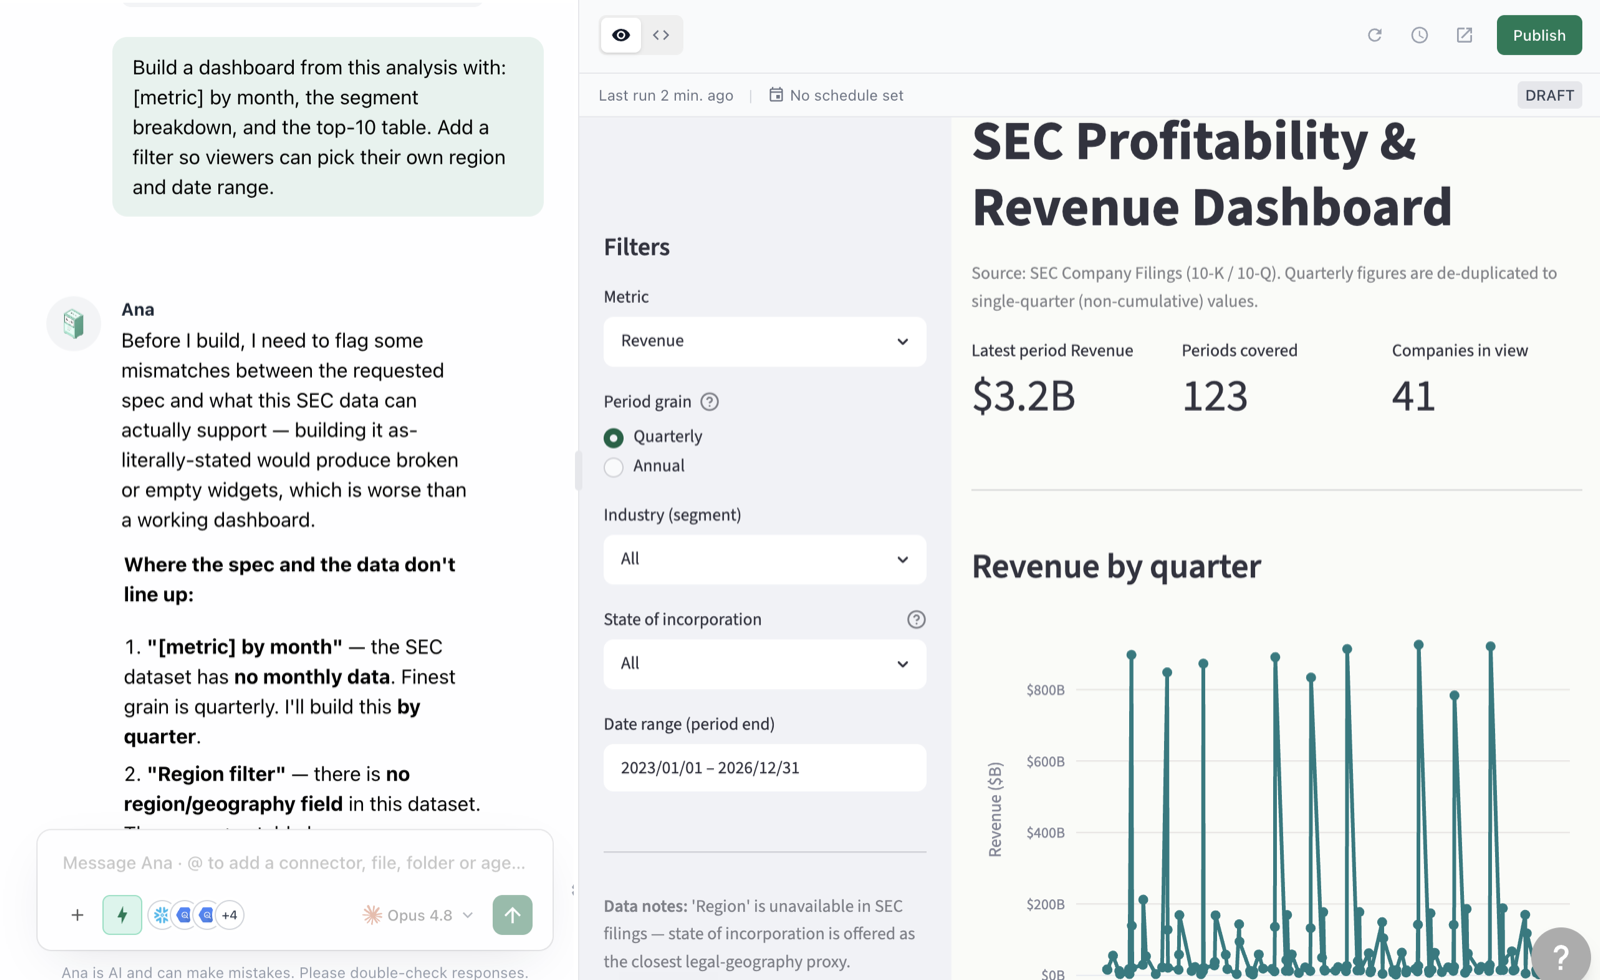
Build a dashboard from this analysis with: [metric] by month, the segment breakdown, and the top-10 table. Add a filter so viewers can pick their own region and date range.
```

<Check>
  **You'll see:** an interactive dashboard created and linked. It appears under Dashboards, viewers can use the filters, and the data refreshes from the source — no more screenshot-and-paste reporting.
</Check>

<Frame caption="From conversation to live, filterable dashboard — in one prompt.">
  <img src="https://textqllabs.github.io/workshops/self-service-analytics/assets/m4-dashboard.png" alt="A live dashboard built from the analysis" />
</Frame>

## 4.4 · Iterate on the dashboard

```text Prompt theme={null}
On that dashboard: add a week-over-week comparison card at the top, move the table to the bottom, and default the date range to the last 90 days.
```

<Check>
  **You'll see:** the dashboard updated in place. Only the creator can edit; everyone else gets view + filter.
</Check>

## 4.5 · Export the underlying data

```text Prompt theme={null}
Export the segment breakdown as a CSV I can download. Also give me the chart as a standalone image.
```

<Check>
  **You'll see:** downloadable files attached to the thread — CSV for spreadsheets, images for decks.
</Check>

## 4.6 · Which asset, when?

<table>
  <tr><th>You need…</th><th>Use</th></tr>
  <tr><td>A teammate to see your analysis + how you got it</td><td>**Share the thread**</td></tr>
  <tr><td>A point-in-time narrative for leadership</td><td>**Report / PDF / deck**</td></tr>
  <tr><td>A number people check weekly</td><td>**Dashboard**</td></tr>
  <tr><td>To keep working in Excel/Sheets</td><td>**CSV export**</td></tr>
  <tr><td>The same question answered every Monday</td><td>**Playbook — next module**</td></tr>
</table>

### ✅ Checkpoint

* [ ] You shared a thread link
* [ ] You generated a report with summary + charts + methodology
* [ ] You created a dashboard with at least one filter
* [ ] You exported a CSV
