

2.1 · Open the work
Take any answer from Module 1 and expand the collapsed tool cells above it. You’ll see the exact SQL that ran, the rows that came back, and any analysis code. You don’t need to read SQL — but it’s there, and your data team can review it in seconds.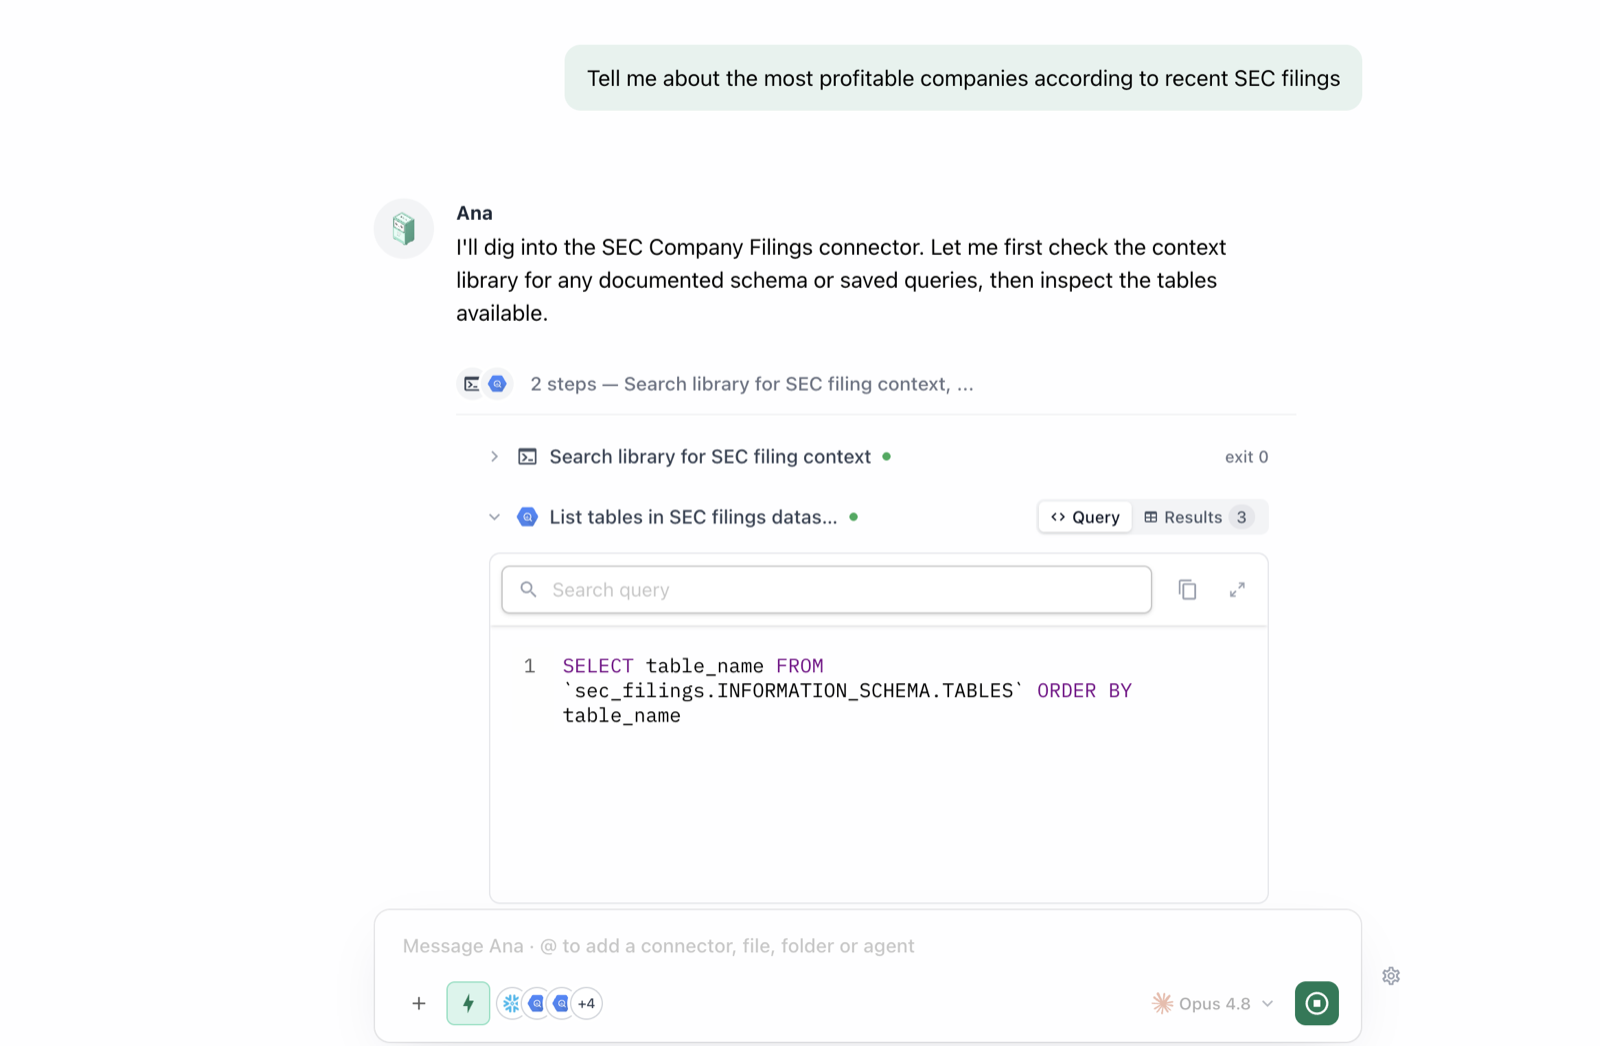
The receipt behind every number: the exact query, expandable in one click.
2.2 · Ask Ana to explain her own work
Prompt
You’ll see: a step-by-step explanation a non-technical stakeholder could follow — table, filters, definitions, assumptions, caveats.
2.3 · Check it against a number you already know
Prompt
You’ll see: either a match (calibration confirmed) or a mismatch. A mismatch is useful — follow with “Why might your number differ from [reference]?” Common causes: time zones, filters (test accounts? refunds?), definitions. You just found a definitional gap; Module 6 fixes it for everyone.
2.4 · Governed answers vs. ad-hoc answers
Prompt
You’ll see: which numbers carry your org’s stamp of approval and which are best-effort. Governed numbers are consistent for everyone who asks; ad-hoc ones are transparent but not yet standardized.
2.5 · The trust checklist
- Source — which table/connector?
- Window — what time range and time zone?
- Filters — what was included/excluded?
- Definition — governed, or on the fly?
- Freshness — when was the data last updated?
Prompt
You’ll see: all five trust dimensions in one footnote you can paste under any chart in a deck.
✅ Checkpoint
- You expanded a tool cell and saw the actual SQL behind an answer
- Ana explained a calculation in plain English on request
- You reconciled (or explained a difference vs.) a number you already knew
- You know how to ask whether a metric is governed