Public Preview — Persistent Dashboards are currently available in Public Preview for all TextQL customers.
Features and interfaces may evolve as we incorporate feedback ahead of general availability.
Overview
Dashboards combine the conversational simplicity of TextQL with the reliability of a production application:- Conversational Creation: Describe the metrics, charts, and layout you want in plain English
- Interactive Exploration: Filter, drill down, and explore data with tooltips, tabs, and controls
- Scheduled Refresh: Dashboards update on a schedule so your team always sees fresh data
- Reusable Data Sources: Dashboards reference named, centrally managed data sources — SQL queries, files, Python code, or ontology queries — that can be shared across multiple dashboards
- Shareable: Publish dashboards for your team or keep them as personal drafts
Dashboards vs. Playbooks
If you already use Playbooks, you might wonder how Dashboards fit in. They are complementary:| Playbooks | Dashboards | |
|---|---|---|
| Purpose | Deliver insights to you | Let you explore data yourself |
| Output | Narrative reports with analysis | Interactive applications with filters and charts |
| Delivery | Email, Slack | Published in TextQL, accessible anytime |
| Execution | Regenerates fresh analysis each run | Runs the same published code reliably on every refresh |
| Best for | ”Tell me what changed and why" | "Give me a live view I can filter and explore” |
Data Sources
Dashboards are powered by Data Sources — named, reusable data connections that Ana creates and manages on your behalf. A data source encapsulates how data is fetched, so the same query or file can be referenced by multiple dashboards without duplication.Data Source Types
| Type | Description |
|---|---|
| SQL Query | A SQL statement run against one of your connected database connectors |
| File | A dataset file (CSV, Excel, etc.) uploaded to TextQL |
| Python Code | A Python script that fetches or transforms data |
| Ontology SQL | A query written against your TextQL ontology |
Permissions
Data source access follows your organization’s role-based access control:- Members can create and edit their own data sources
- Admins can view and edit all data sources in the organization
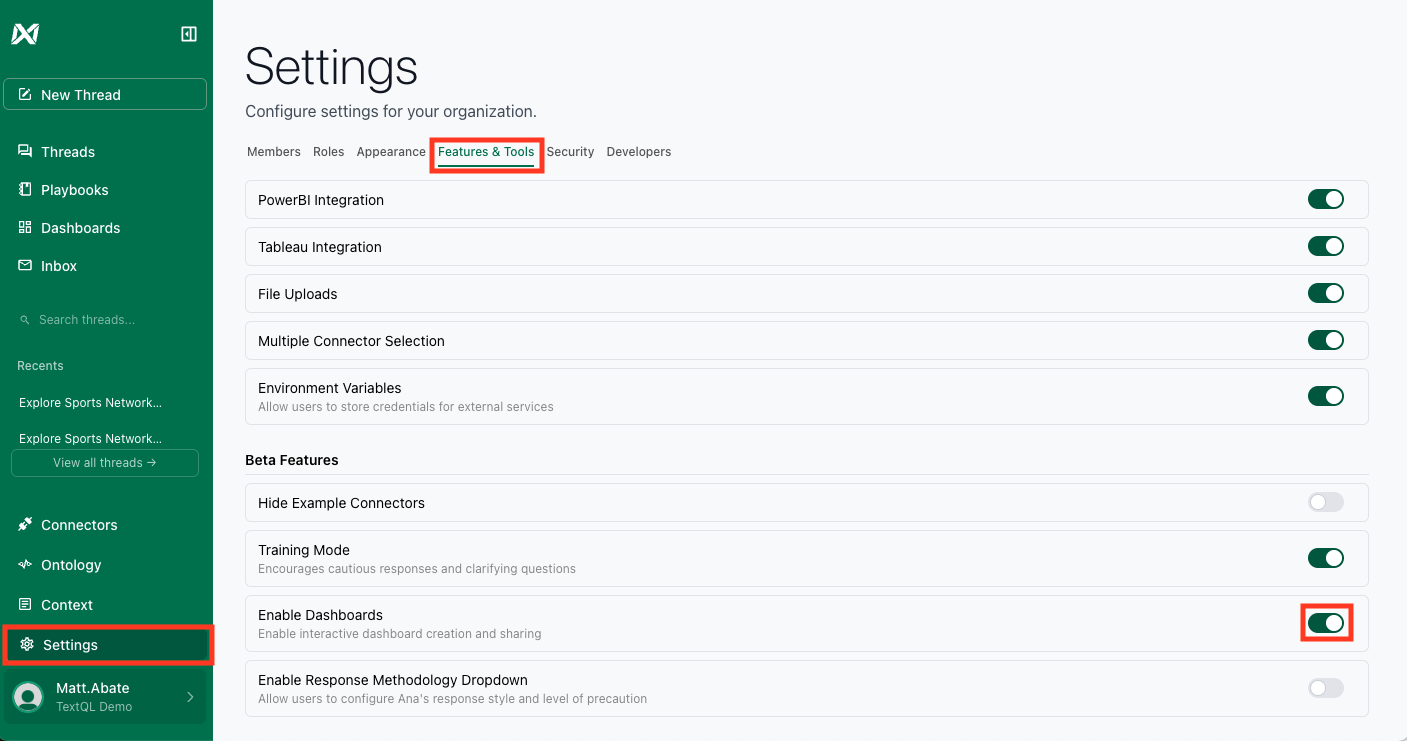
Enabling Dashboards
Dashboards must be enabled for your workspace before you can use them.- Navigate to Settings → Capabilities
- Toggle Enable Dashboards to on
Creating a Dashboard
Step 1: Start a Conversation
Open a new chat with Ana and describe the dashboard you want. You can be as high-level or as detailed as you like:- High-level: “Build me an executive overview of pipeline and revenue”
- Detailed: “Create a dashboard with monthly revenue by region, a customer segment breakdown, and a trend line for churn rate over the last 12 months. Include filters for region and date range.”
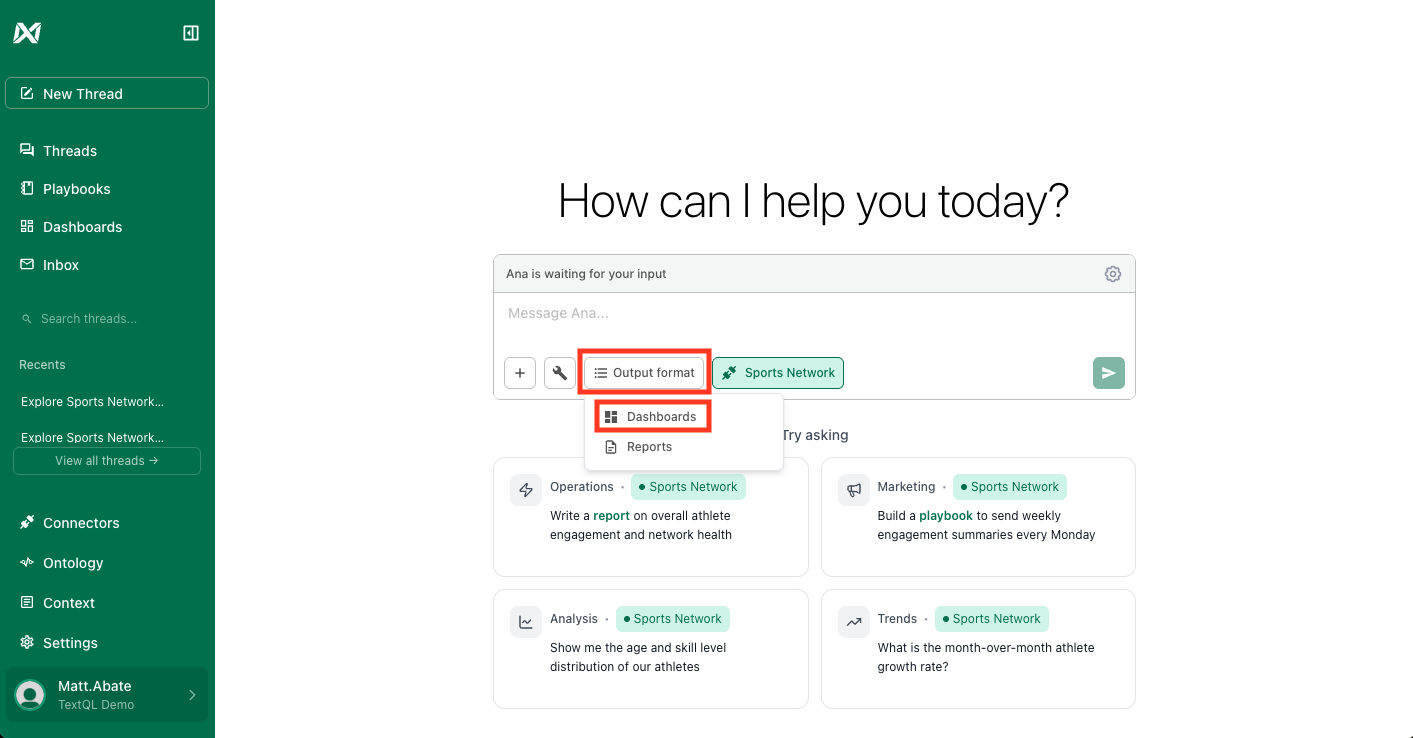
Step 2: Select the Dashboard Output Format
At any point in a chat, you can switch Ana’s output to the dashboard format:- Click Output Format in the chat toolbar
- Select Dashboard
Step 3: Iterate and Refine
Once Ana generates an initial dashboard, you can refine it through conversation:- “Add a filter for date range”
- “Change the bar chart to a line chart”
- “Add a tab for regional breakdown”
- “Make the table sortable by revenue”
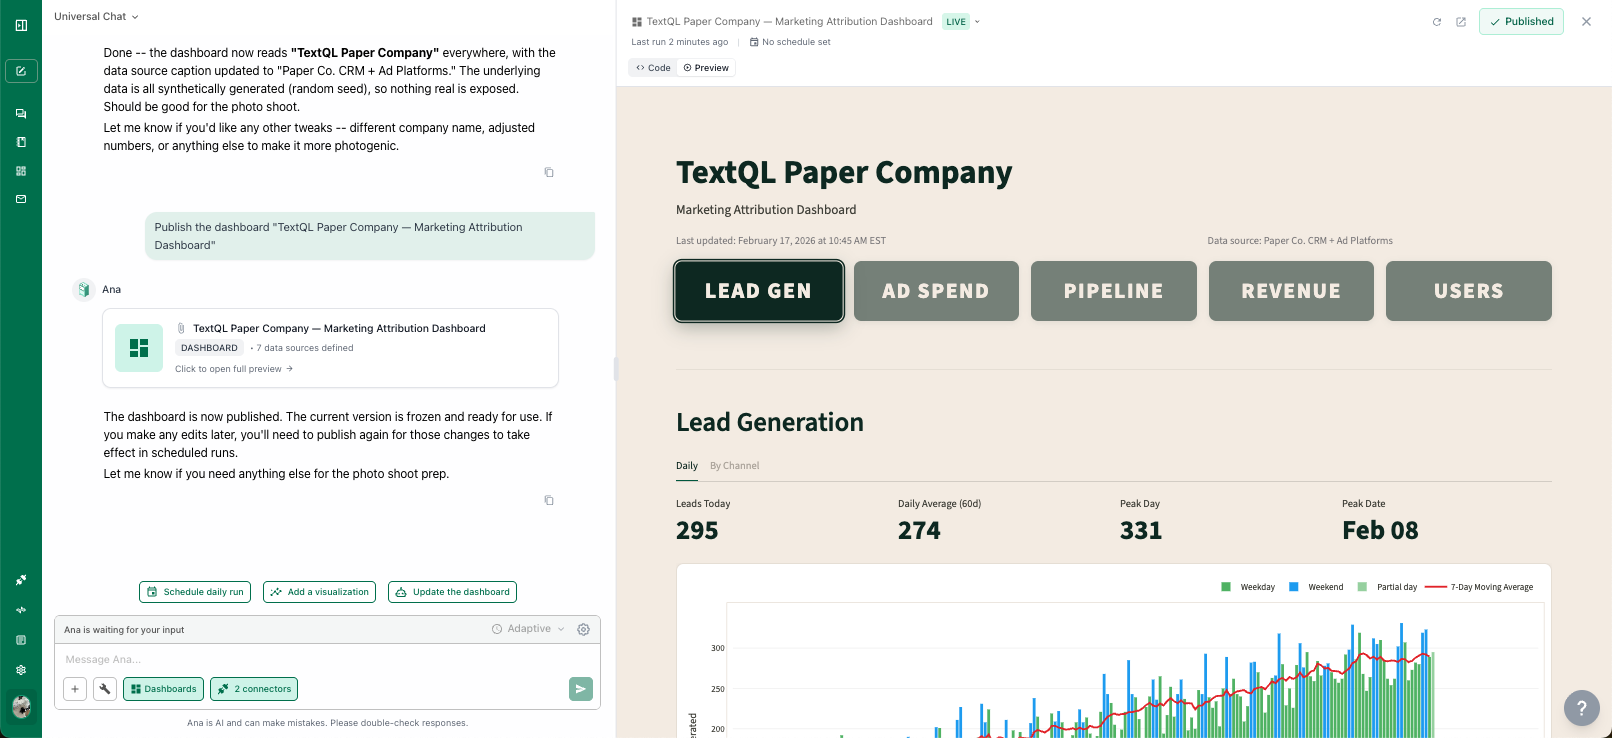
Step 4: Publish Your Dashboard
When you are satisfied with the result, publish it to make it persistent and accessible to your team. Click the Publish dropdown and select Publish Now. Your dashboard is now accessible from the Dashboards page in the left navigation. Publishing also creates a version checkpoint that you can roll back to later if needed.Managing Dashboards
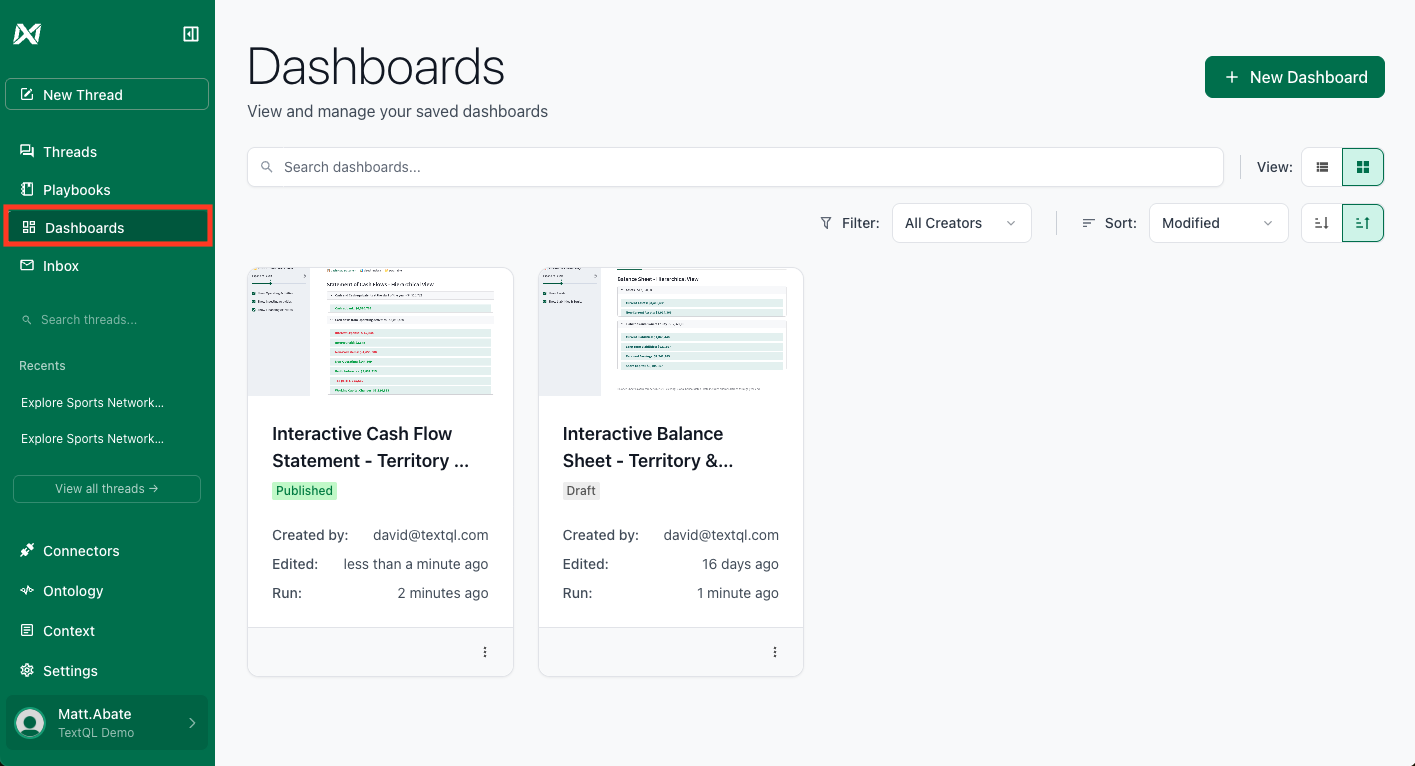
The Dashboards Page
The Dashboards page is your central hub for viewing and managing all dashboards:- My Dashboards: Dashboards you created and published as personal
- Team Dashboards: Dashboards published and shared across your organization
- Drafts: Work-in-progress dashboards that have not yet been published
Scheduling Refreshes
Dashboards can be configured to refresh on a schedule so your data stays current:- Open a published dashboard
- Click Schedule
- Set a refresh frequency (e.g., every hour, daily, weekly)
Editing a Dashboard
To modify a published dashboard, open it and click the Chat button (or Chat with Dashboard in the toolbar). This brings you back into a conversational session with Ana where you can make changes. When finished, use the Publish dropdown and select Publish Now to create a new version. To view or roll back to a previous version, open the Publish dropdown and select History.What You Can Build
Dashboards support the full range of Streamlit components, which means you can build rich, interactive applications:Multi-Source Dashboards
Pull from Snowflake, Salesforce, Amplitude, and your product analytics — all joined and visualized in one place.
Executive Overviews
KPI cards, trend lines, and summary tables that refresh daily for leadership review.
Operational Monitors
Real-time views of pipeline health, support ticket volume, or infrastructure metrics with filters and drill-downs.
Dashboards from Inspiration
Send Ana a screenshot, PDF, or sketch of a dashboard you like. She will rebuild it connected to your data.
Building from a Screenshot or Reference
See a dashboard you like but do not have access to the original? Found a layout in a slide deck or report? Send Ana a screenshot, PDF, or even a rough sketch. She will interpret the layout, identify the visualizations, and build a working version connected to your data sources.Compute and Cost
Dashboards run on TextQL’s sandbox-backed compute, the same ACU-metered service that powers chat and playbooks. A few points worth knowing:- Viewing a dashboard provisions a sandbox. The first time a published dashboard is opened or refreshed after being released, a dedicated sandbox is provisioned to run its code. This single provisioning is the only event that starts a billing period — within that warm window.
- Additional viewers and refreshes are free. Once a dashboard’s sandbox is warm, more people viewing it, page refreshes, and manual or scheduled data refreshes do not provision new compute and do not cost extra.
- Dashboards stay warm for 24 hours. Unlike chat and playbook sandboxes (which release after 1 hour of inactivity), a dashboard’s sandbox remains warm for 24 hours after it was last viewed, then is automatically released. The next view simply provisions it again. The longer window reflects how dashboards are actually used: they tend to be viewed repeatedly throughout the day — often by several people and on a recurring daily cadence — so a 24-hour window keeps the sandbox warm across a full business day and overnight, making the first view each morning instant and keeping a typical day of viewing to a single provisioning.
If your organization or a member runs out of ACUs, a dashboard whose sandbox is still warm remains viewable and refreshable until that sandbox is released. Re-provisioning a released sandbox requires available ACUs.
Security and Permissions
Dashboards inherit the security model of your TextQL organization:- Row-Level Security: If your database connector has RLS policies, they apply to dashboard queries automatically
- Role-Based Access Control: Only users with appropriate permissions can view or edit dashboards and their underlying data sources
- Secure Deployment: For on-premises or VPC deployments, dashboard data never leaves your perimeter
Dashboard visibility is controlled by the creator. Personal dashboards are visible only to you.
Team dashboards are visible to all members of your organization with appropriate access.
Troubleshooting
| Issue | Solution |
|---|---|
| Dashboard toggle not visible in Settings | Confirm you have admin permissions. Contact support@textql.com if the option is missing. |
| Dashboard not refreshing | Check that a schedule is configured and that your data source connectors are active. |
| Charts showing stale data | Verify the refresh schedule and confirm that the underlying data source has been updated. |
| Permission errors when viewing a team dashboard | Ask the dashboard creator to verify the visibility setting, or contact your organization admin. |
Getting Support
If you have questions about Dashboards or run into issues, reach out to support@textql.com or visit the customer support page.Persistent Dashboards are in Public Preview. We are actively incorporating feedback to improve the experience ahead of general availability. If you have suggestions or encounter issues, we would love to hear from you.