Overview
Observability is a retrospective tool for organization administrators. It gives you a structured view of past threads, playbook runs, agents, dashboards, and connectors across your workspace.
After threads complete, TextQL automatically analyzes them for quality signals: gaps in context, execution errors, signs of user frustration, potential inaccuracies. These appear as warnings attached to individual threads, which you can drill into to understand exactly what happened and where things broke down.
The goal is to give administrators a systematic way to:
- Monitor analysis quality across your organization over time
- Identify patterns — recurring warning types, problematic connectors, or topic areas where Ana consistently struggles
- Apply targeted fixes — improving ontology coverage, enriching the Ontology, or adjusting connector configuration based on what you find
- Drive user education — spotting where users are asking questions Ana cannot yet answer well, and helping them prompt more effectively in the meantime
Access it from the left sidebar under Observability.
Observability is available to organization administrators only. If you do not see it in your sidebar, confirm that you have admin privileges.
Time Range
Use the time range selector (top right) to control the window of data shown across all tabs. Options are Last 7 days, Last 14 days, Last 30 days, and Last 90 days.
Overview Tab
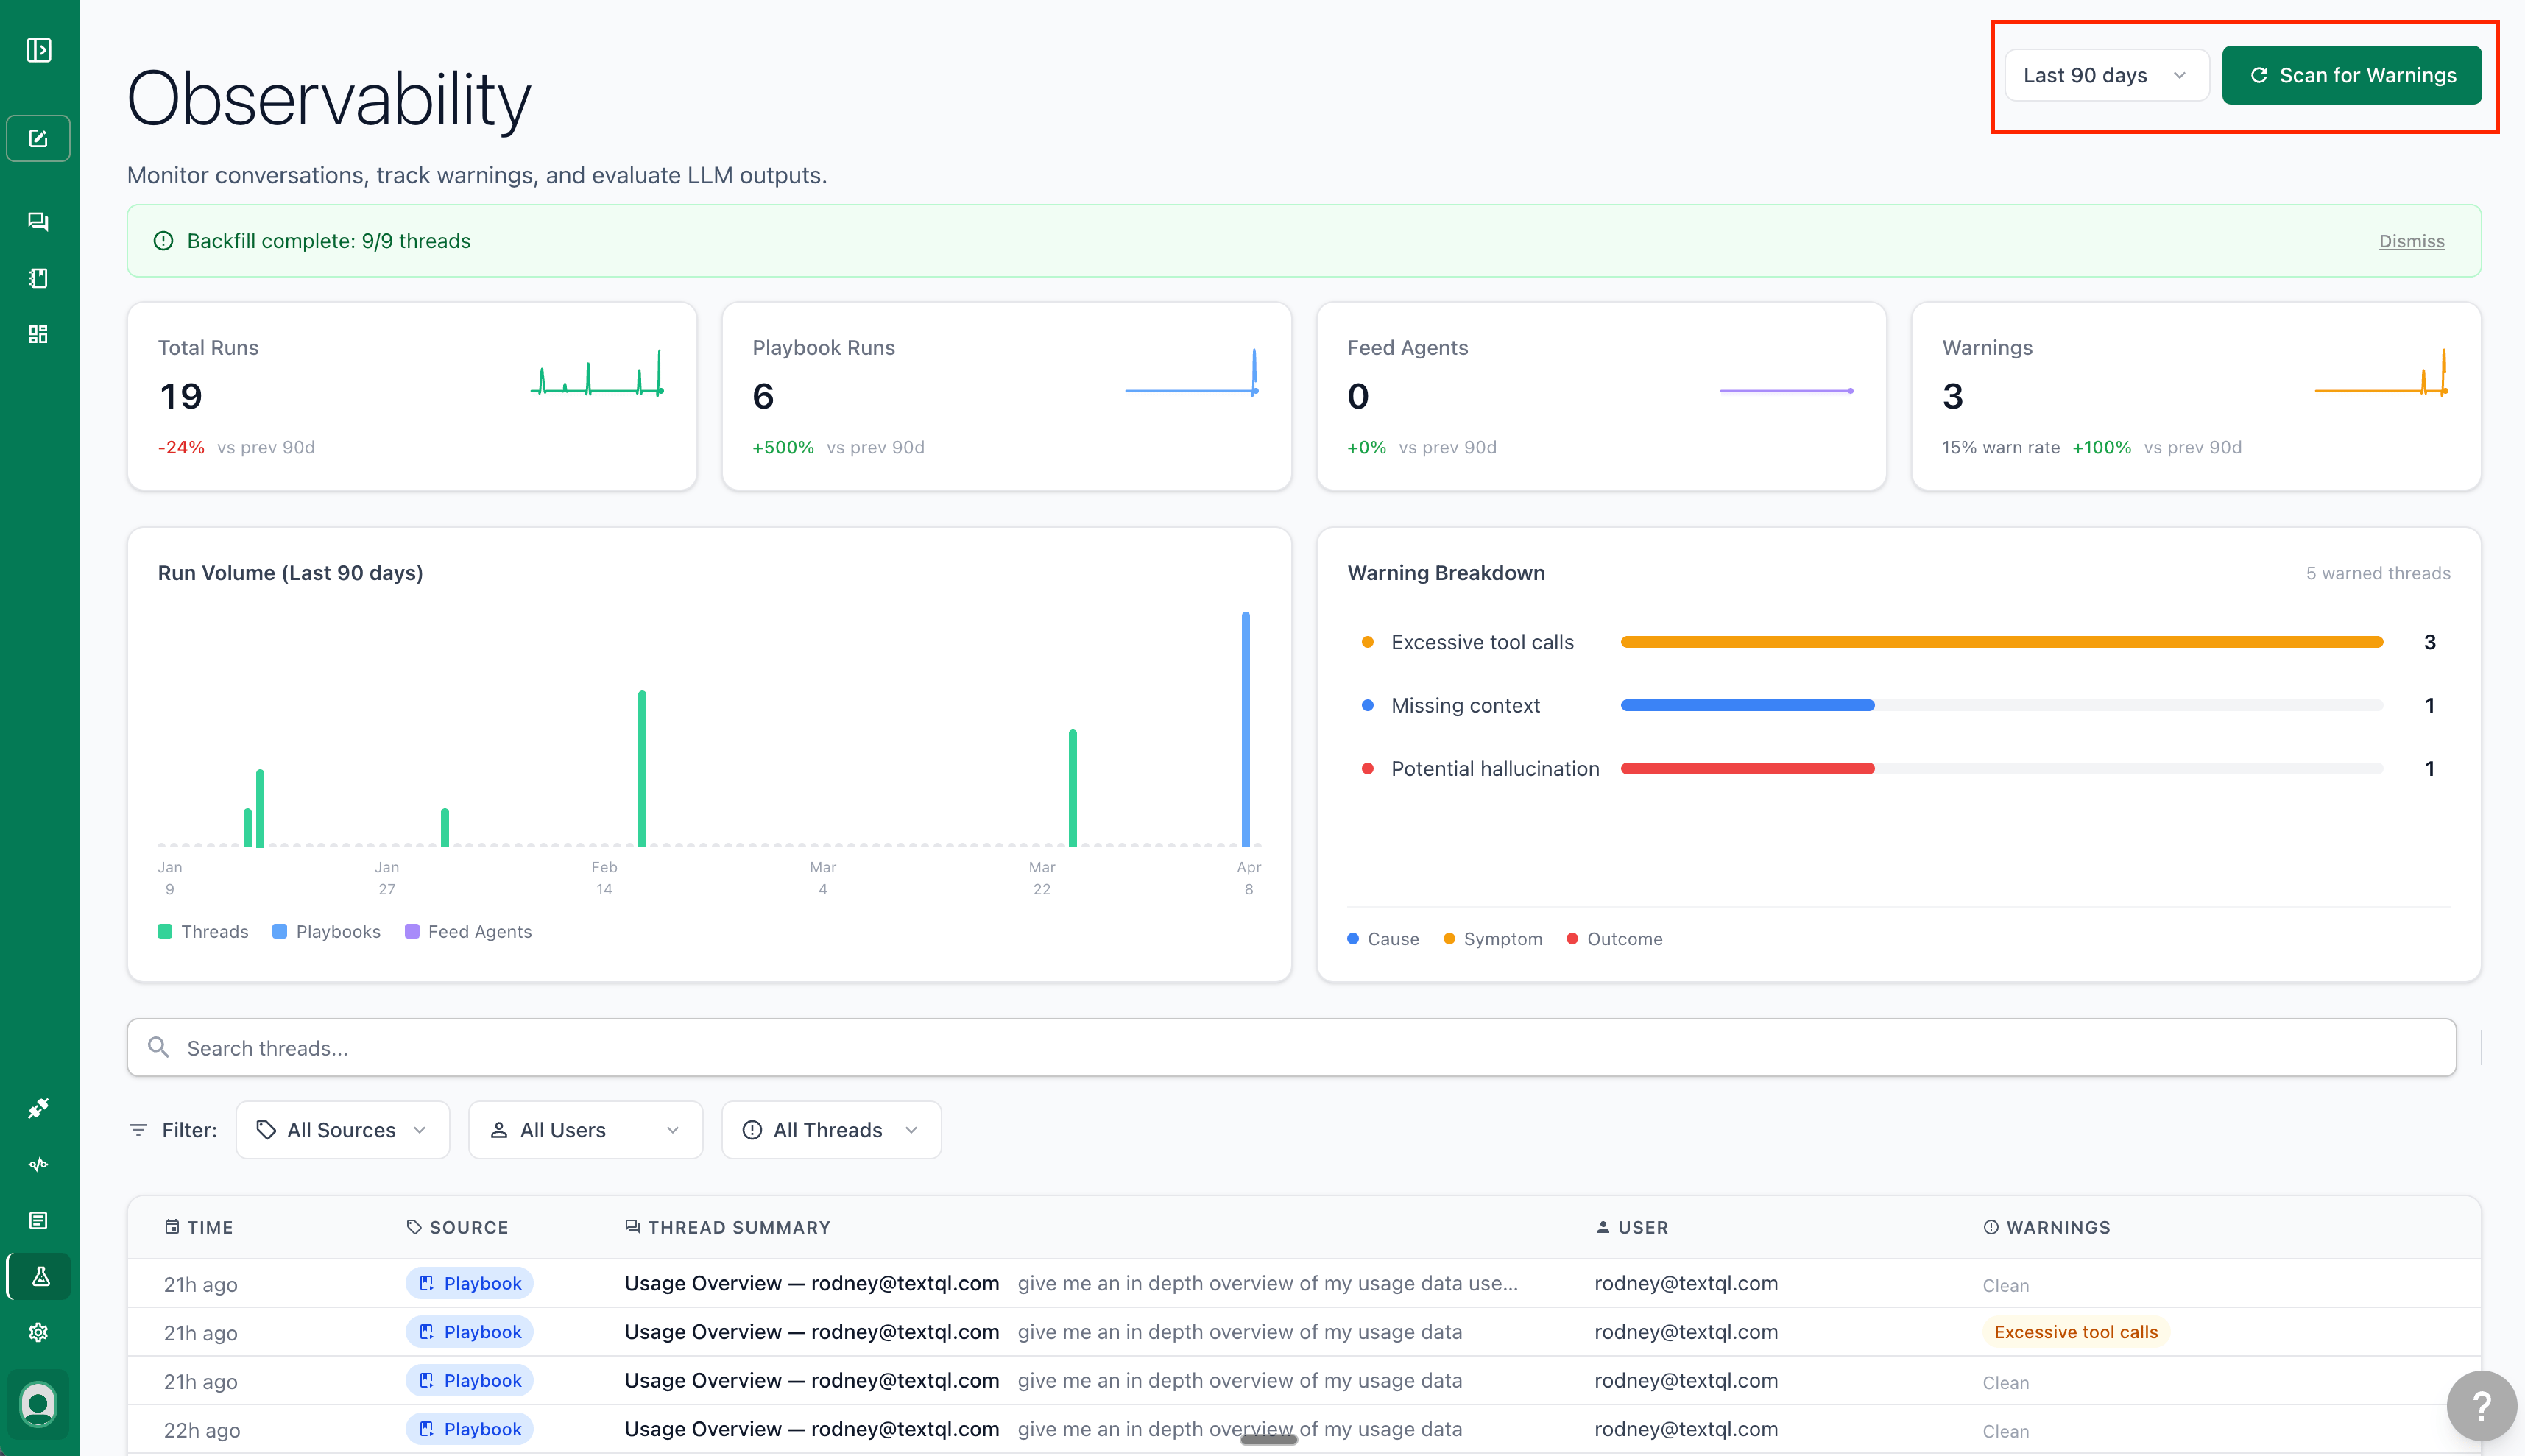
The Overview tab is the main monitoring surface. It shows thread and playbook activity, warning trends, and a full searchable table of runs.
Stats Bar
Summary cards at the top show aggregate metrics for the selected time range, each with a delta vs. the previous equivalent period:
- Total Runs — all thread runs across the workspace
- Playbook Runs — runs triggered by scheduled playbooks
- Slack — runs initiated via the Slack integration
- Feed Agents — visible when Feed Agents are enabled or when feed agent activity exists in the selected range
- Warnings — total warnings detected, with a warn rate percentage
Run Volume Chart
A bar chart breaking down run volume over time, color-coded by source: Threads, Playbooks, Slack, and Feed Agents.
Warning Breakdown
Next to the run volume chart, the Warning Breakdown panel ranks the most frequent warning types by count. Click any warning type to filter the thread table below to show only threads with that warning.
Warnings are color-coded by category:
- Causes (blue) — configuration issues you can fix
- Symptoms (orange) — execution problems
- Outcomes (red) — user-facing impact
Warning Types
Causes — Configuration issues you can fix
These warnings indicate that the agent lacked the information it needed. Fixing them usually means improving your ontology or semantic layer.
| Warning | Severity | What it means | Suggested action |
|---|
| Missing context | High | The agent lacked ontology or semantic layer information needed to answer accurately | Add missing table/column descriptions to the semantic layer, or onboard the relevant data source |
| Ignored instruction | Medium | Ana skipped steps specified in the prompt or failed to execute required tool calls | Review the conversation to see which instruction was missed; consider improving prompt instructions or adding context |
Symptoms — Execution problems
These warnings indicate something went wrong while the agent was running.
| Warning | Severity | What it means | Suggested action |
|---|
| Error loop | High | The agent hit 5+ consecutive execution errors | Review the error messages and check if the agent is retrying a fundamentally broken approach |
| Connector errors | Medium | 5+ SQL execution errors occurred | Review SQL errors for common patterns; check connector permissions and schema accuracy |
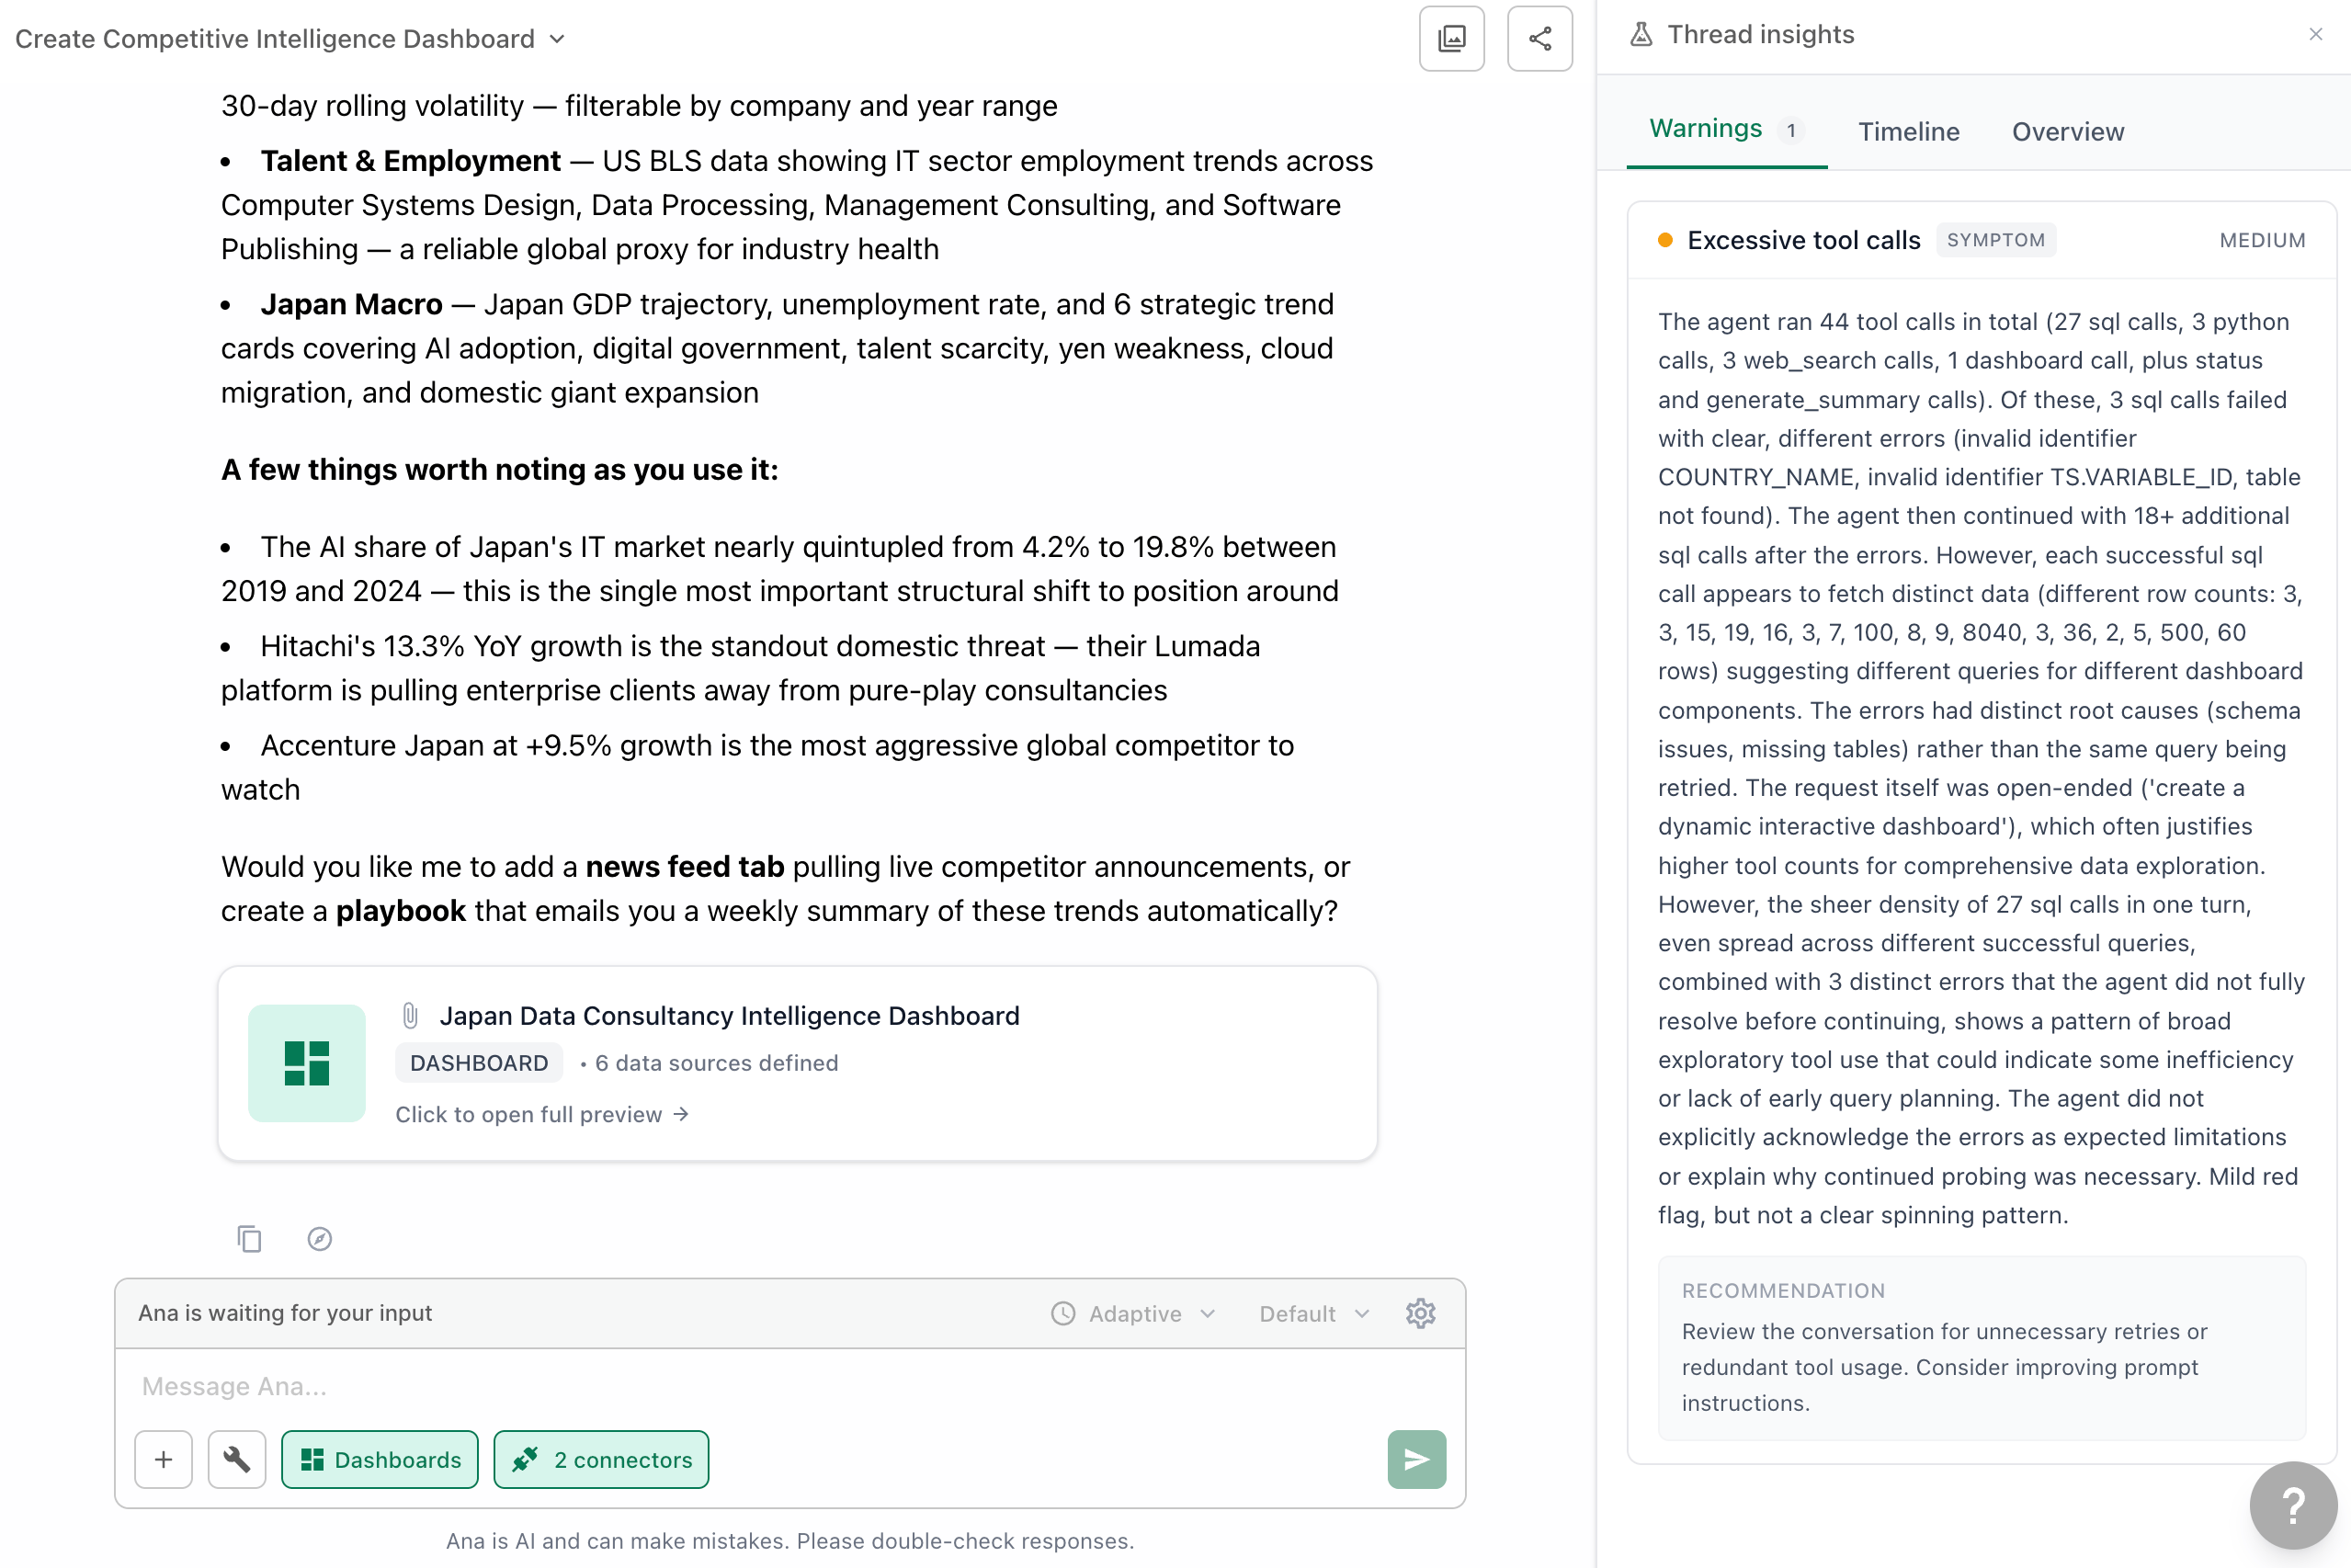
| Excessive tool calls | Medium | The agent made 57+ tool calls | Review the conversation for unnecessary retries or redundant tool usage; consider improving prompt instructions |
| Slow query | Medium | A SQL query took more than 25 minutes | Review the query plan for missing indexes or expensive joins; consider materializing frequently-queried aggregations |
| Long conversation | Low | The conversation has 74+ cells | Check if the user’s needs were met; long conversations may indicate missing context or unclear ontology |
| No results | Low | A query returned an empty result set unexpectedly | Verify the data exists for the queried time range; check filters and join conditions in the generated SQL |
Outcomes — User-facing impact
These warnings indicate the user had a negative experience.
| Warning | Severity | What it means | Suggested action |
|---|
| User frustration | Medium | The user expressed frustration or had to repeat their question | Review the agent’s responses for accuracy; consider adding example queries or refining prompt instructions |
| Potential hallucination | High | The agent may have presented fabricated or inaccurate data | Verify the data accuracy; review the SQL query logic and ensure the ontology mappings are correct |
Filters
The filter bar appears above the table:
- Search — Search threads by summary content
- Source — Filter by thread source: All Sources, Threads, Playbooks. A Feed option appears when Feed Agents are enabled or when feed agent activity exists.
- Users — Multiselect dropdown to filter by one or more team members
- Warning — Filter by warning status: All threads, Any warning, or a specific warning type
Click Clear filters to reset all active filters.
Thread Table
The main table lists every thread and playbook run within the selected time range. Each row shows:
- Timestamp — When the thread was created
- Source — Thread, Playbook, or Slack
- Summary — A short description of what the user asked
- User — The email of the member who created the thread
- Warnings — Any quality warnings detected on the thread
Rows with warnings are highlighted. Click any row to open the Thread Detail Panel on the right.
Thread Detail Panel
The Thread Insights panel lets you identify which message or query to investigate and understand how to fix it.
| Tab | What it shows |
|---|
| Warnings | All warnings detected on this thread, with description and suggested action |
| Timeline | Total duration, LLM vs. execution time split, and a turn-by-turn breakdown |
| Overview | High-level stats: total duration, turns, steps, LLM time, and execution time |
Backfilling Warnings
New threads are scanned for warnings automatically. Threads created before Observability was enabled will not have warnings attached. To analyze older threads, use the Scan for Warnings feature.
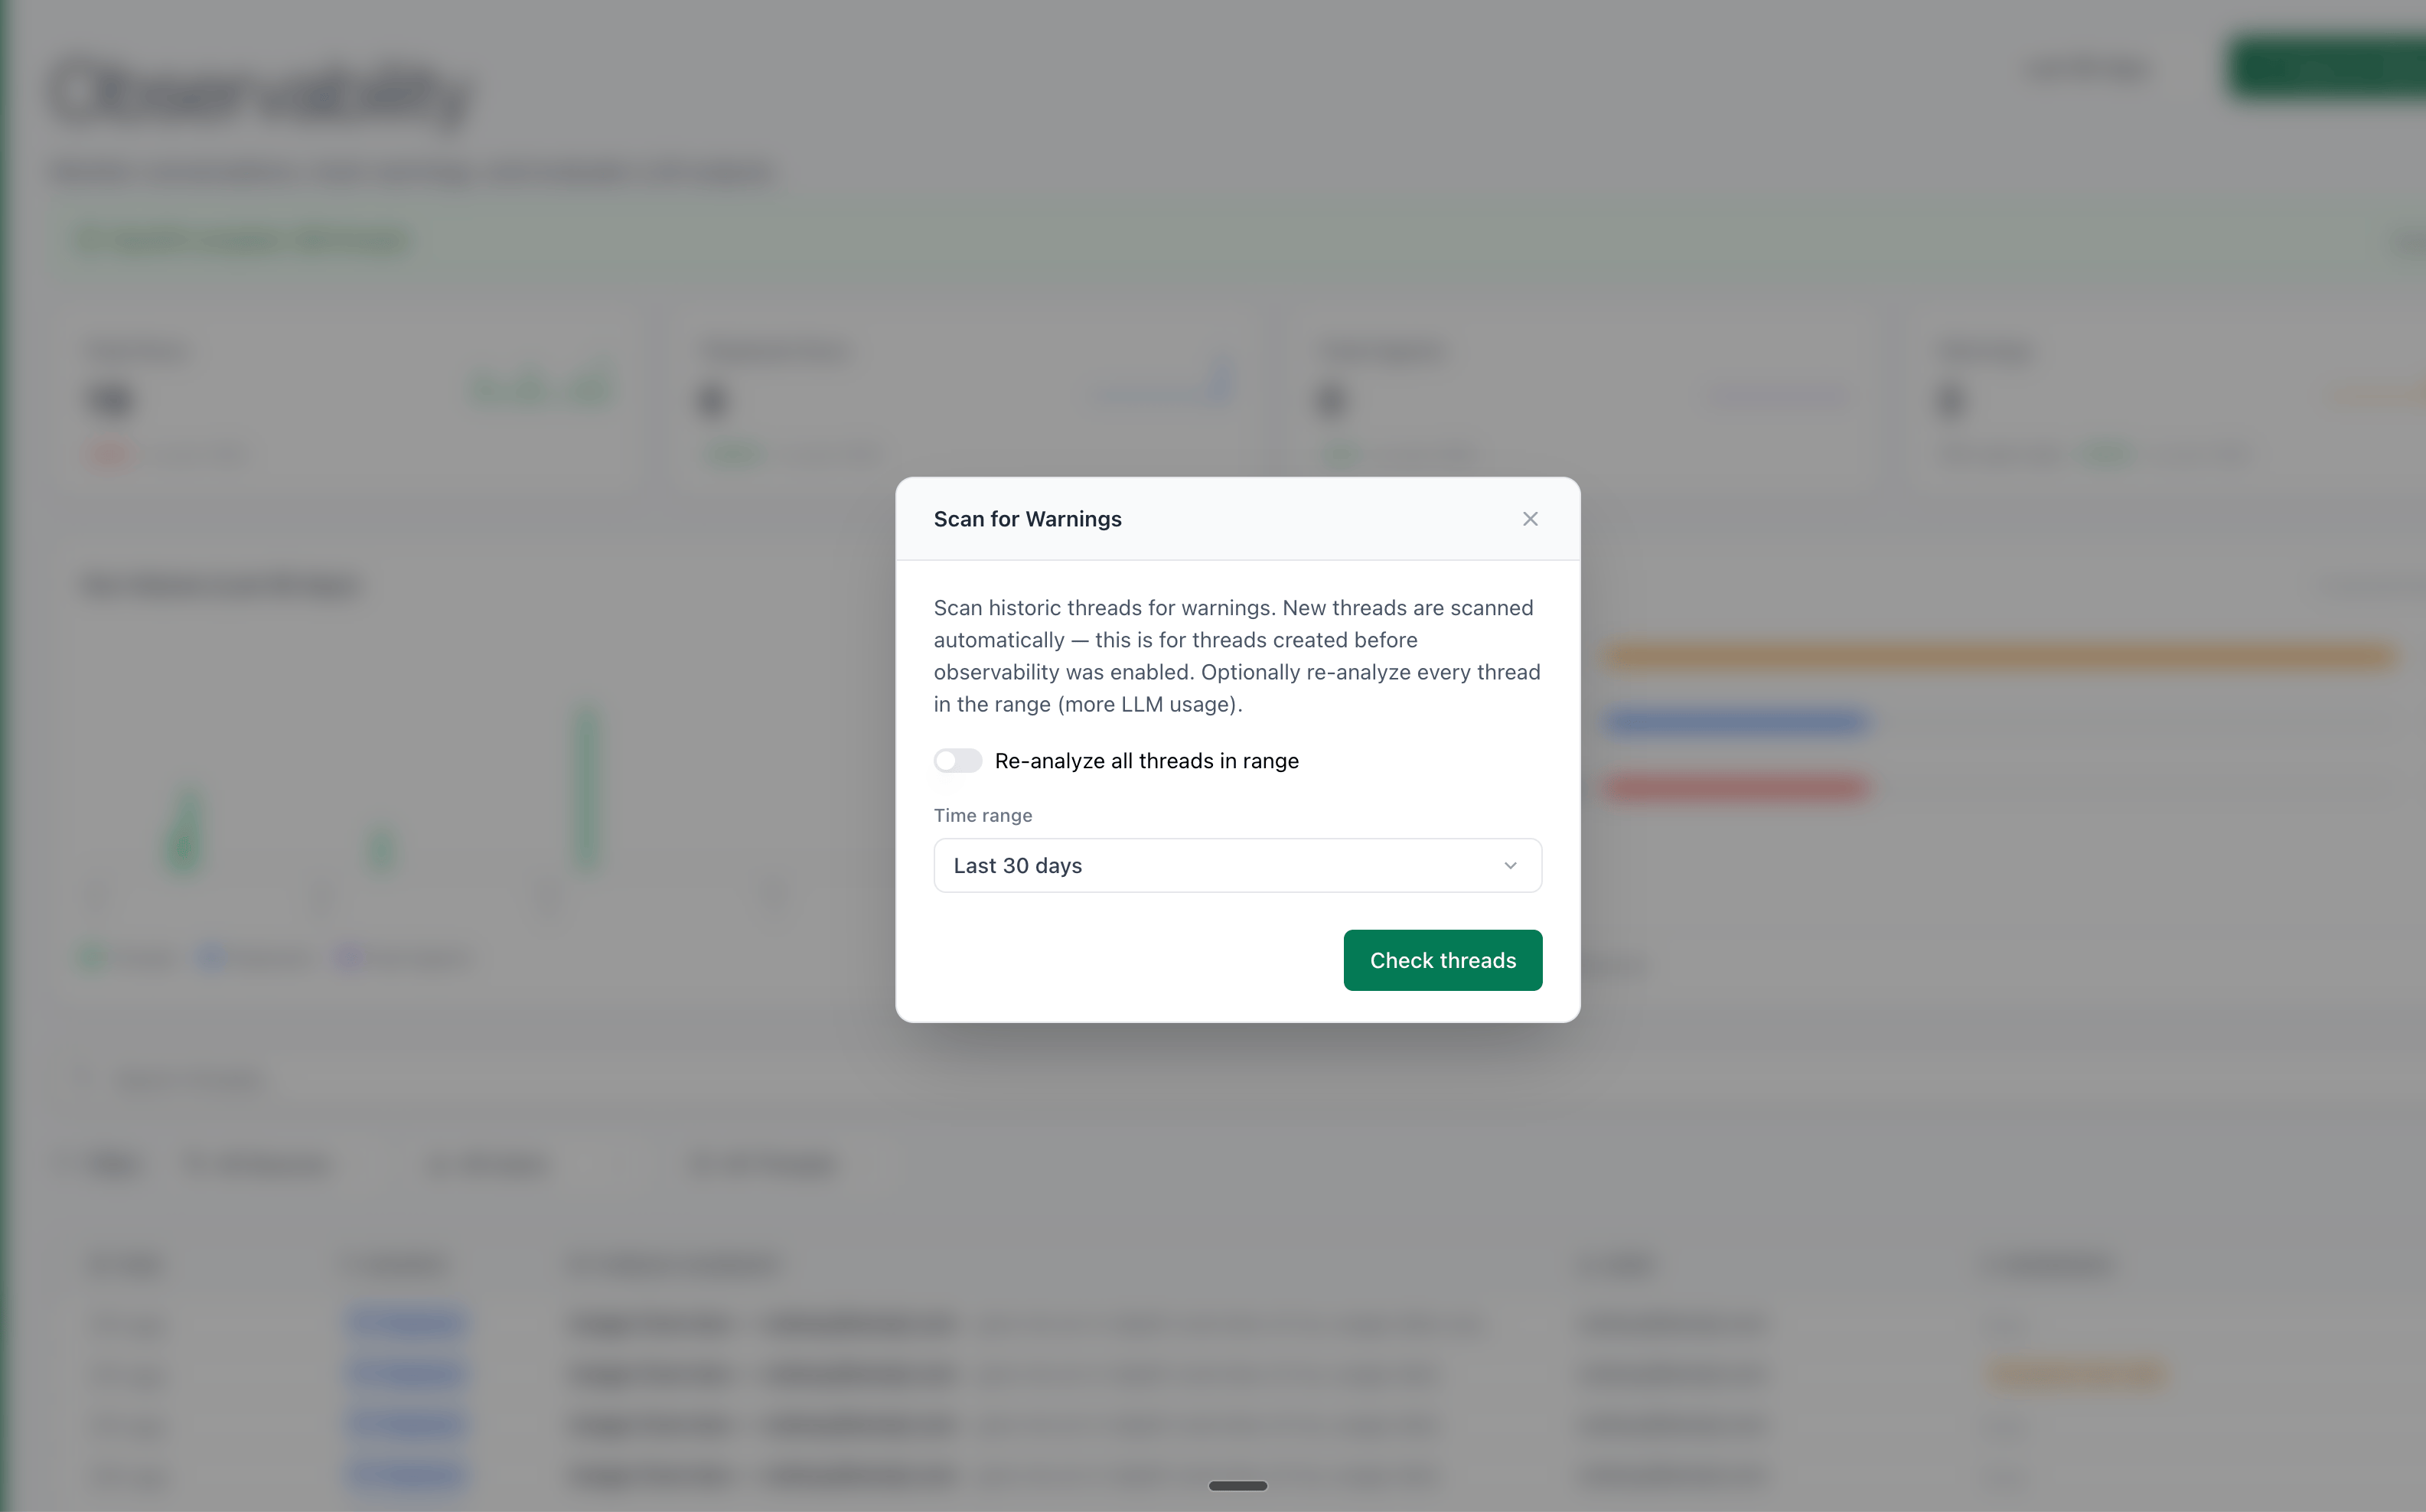
If unanalyzed threads are detected, a Scan for Warnings button appears in the page header. Clicking it opens a modal to configure the scan:
- Time range — Choose how far back to scan: Last 7 days, Last 14 days, Last 30 days, or Last 90 days
- Re-analyze all threads in range — When enabled, re-evaluates every thread in the range including already-analyzed ones. Off by default.
Click Check threads to preview how many threads will be scanned, then Analyze N threads to start. A progress banner shows how many threads have been processed. The dashboard refreshes automatically once complete.
Users Tab
The Users tab shows a breakdown of activity and ACU consumption by individual team member.
Summary Cards
- Active Users — Number of users who ran at least one thread in the selected period
- Avg ACU / User — Average ACUs consumed per active user
- Top Spender — The user who consumed the most ACUs, with their total for the period
Users Table
| Column | Description |
|---|
| User | Member email and display name |
| Threads | Number of threads started |
| Playbooks | Number of playbook runs attributed to this user |
| Dashboards | Number of dashboard views |
| Agents | Number of feed agent runs |
| Activity | Sparkline showing activity trend over the selected period |
| ACUs | Total ACUs consumed |
Agents Tab
The Agents tab shows activity and performance for Feed Agents across your organization.
Summary Cards
- Active Agents — Agents with at least one run in the period, out of the total configured
- ACUs Consumed — Total ACUs consumed by feed agents this period
- Warn Rate — Percentage of agent threads that have at least one warning
Agents Table
| Column | Description |
|---|
| Agent | Agent name |
| Owner | The user who owns the agent |
| Runs | Number of runs in the period |
| Frequency | How often the agent runs |
| ACUs | Total ACUs consumed |
| Warnings | Number of warnings detected across runs |
| Status | Active or inactive |
Playbooks Tab
The Playbooks tab shows scheduled Playbook usage, run counts, and cost breakdown.
Summary Cards
- Playbooks — Active playbooks (with runs in the period) vs. total configured
- ACUs Consumed — Total ACUs consumed by playbook runs this period
- Total Runs — Number of chats triggered by playbooks
Playbooks Table
| Column | Description |
|---|
| Playbook | Playbook name |
| Owner | The user who owns the playbook |
| Runs | Number of runs in the period |
| LLM ACUs | ACUs from language model calls |
| Compute ACUs | ACUs from code execution and compute |
| Total ACUs | Combined ACU cost |
| Status | Active or inactive |
Dashboards Tab
The Dashboards tab shows usage and cost for all Dashboards in your organization.
Summary Cards
- Dashboards — Total dashboards in the organization
- ACUs Consumed — Total ACUs consumed by dashboard refreshes this period
- Total Views — Page views across all dashboards in the period
Dashboards Table
| Column | Description |
|---|
| Dashboard | Dashboard name |
| Owner | The user who owns the dashboard |
| Views | Number of page views |
| Refreshes | Number of data refreshes |
| ACUs | Total ACUs consumed |
| Published | Whether the dashboard is published |
Connectors Tab
The Connectors tab gives a health and usage view of every data connector in your organization.
Summary Cards
- Total Connectors — Number of connectors configured in the org
- Total Queries — Number of queries run against connectors this period
- Avg Error Rate — Average error rate across all connectors
Connectors Table
| Column | Description |
|---|
| Connector | Connector name and type icon |
| Queries | Number of queries run this period |
| Error Rate | Percentage of queries that returned an error (highlighted in red when elevated) |
| Avg Time | Average query execution time |
| Users | Number of distinct users who queried this connector |
| Last Queried | Time since the most recent query |
| Status | Active or inactive |
Further Reading
Need Help?
If you’re seeing warnings you don’t know how to resolve, or Observability isn’t behaving as expected, contact support at support@textql.com.