| Stream | What it exports | Where to configure |
|---|---|---|
| Audit logs | Key actions in the platform: queries run, connectors configured, and more | Settings → Audit Log → Export tab |
| Product metrics | Usage, performance, and operational signals | Observability → Export tab |
Audit Log Export
Access from Settings → Audit Log, then click the Export tab.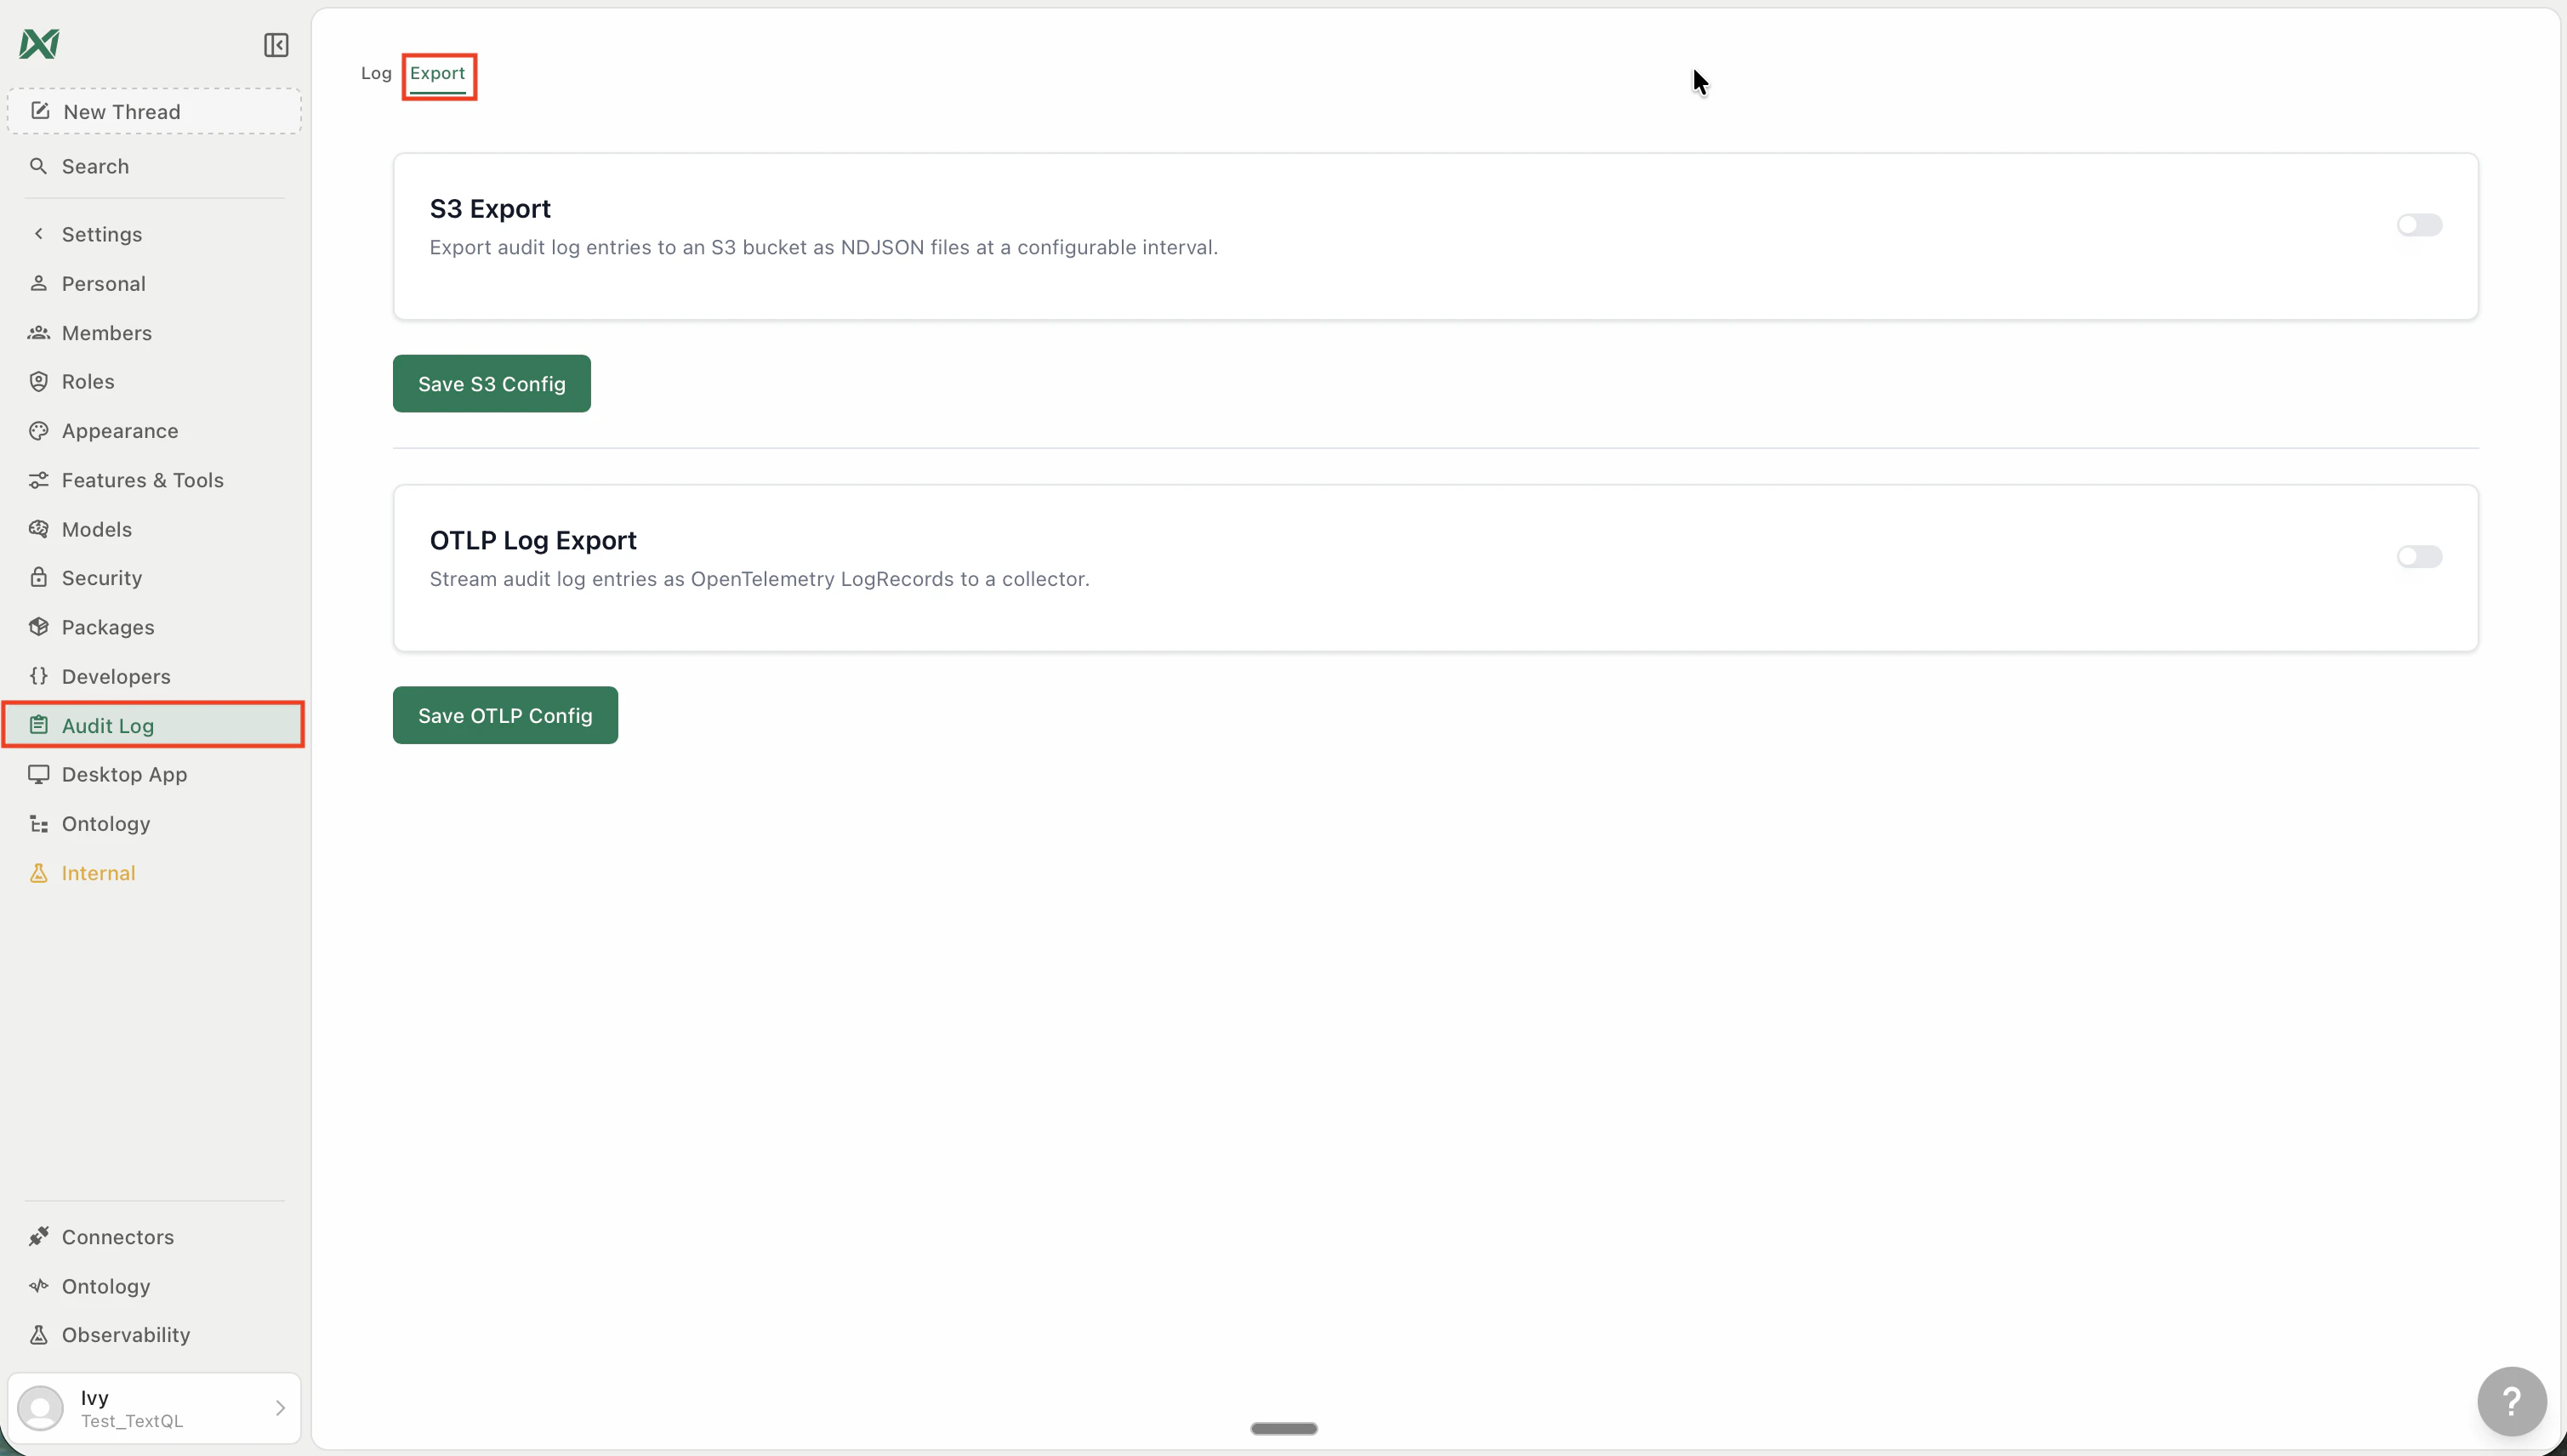
S3 Export
Exports audit log entries to an Amazon S3 bucket as NDJSON files at a configurable interval. To configure:- Go to Settings → Audit Log → Export
- Under S3 Export, toggle it on
- Enter your S3 bucket name, region, and credentials
- Click Save S3 Config
OTLP Log Export
Streams audit log entries as OpenTelemetryLogRecord objects to any OTLP-compatible collector — Datadog, Splunk, Grafana Loki, Honeycomb, and others.
To configure:
- Go to Settings → Audit Log → Export
- Under OTLP Log Export, toggle it on
- Enter your OTLP endpoint URL and any required headers (e.g.
Authorization: Bearer <token>) - Click Save OTLP Config
Metrics Export
Access from Observability → Export in the left sidebar.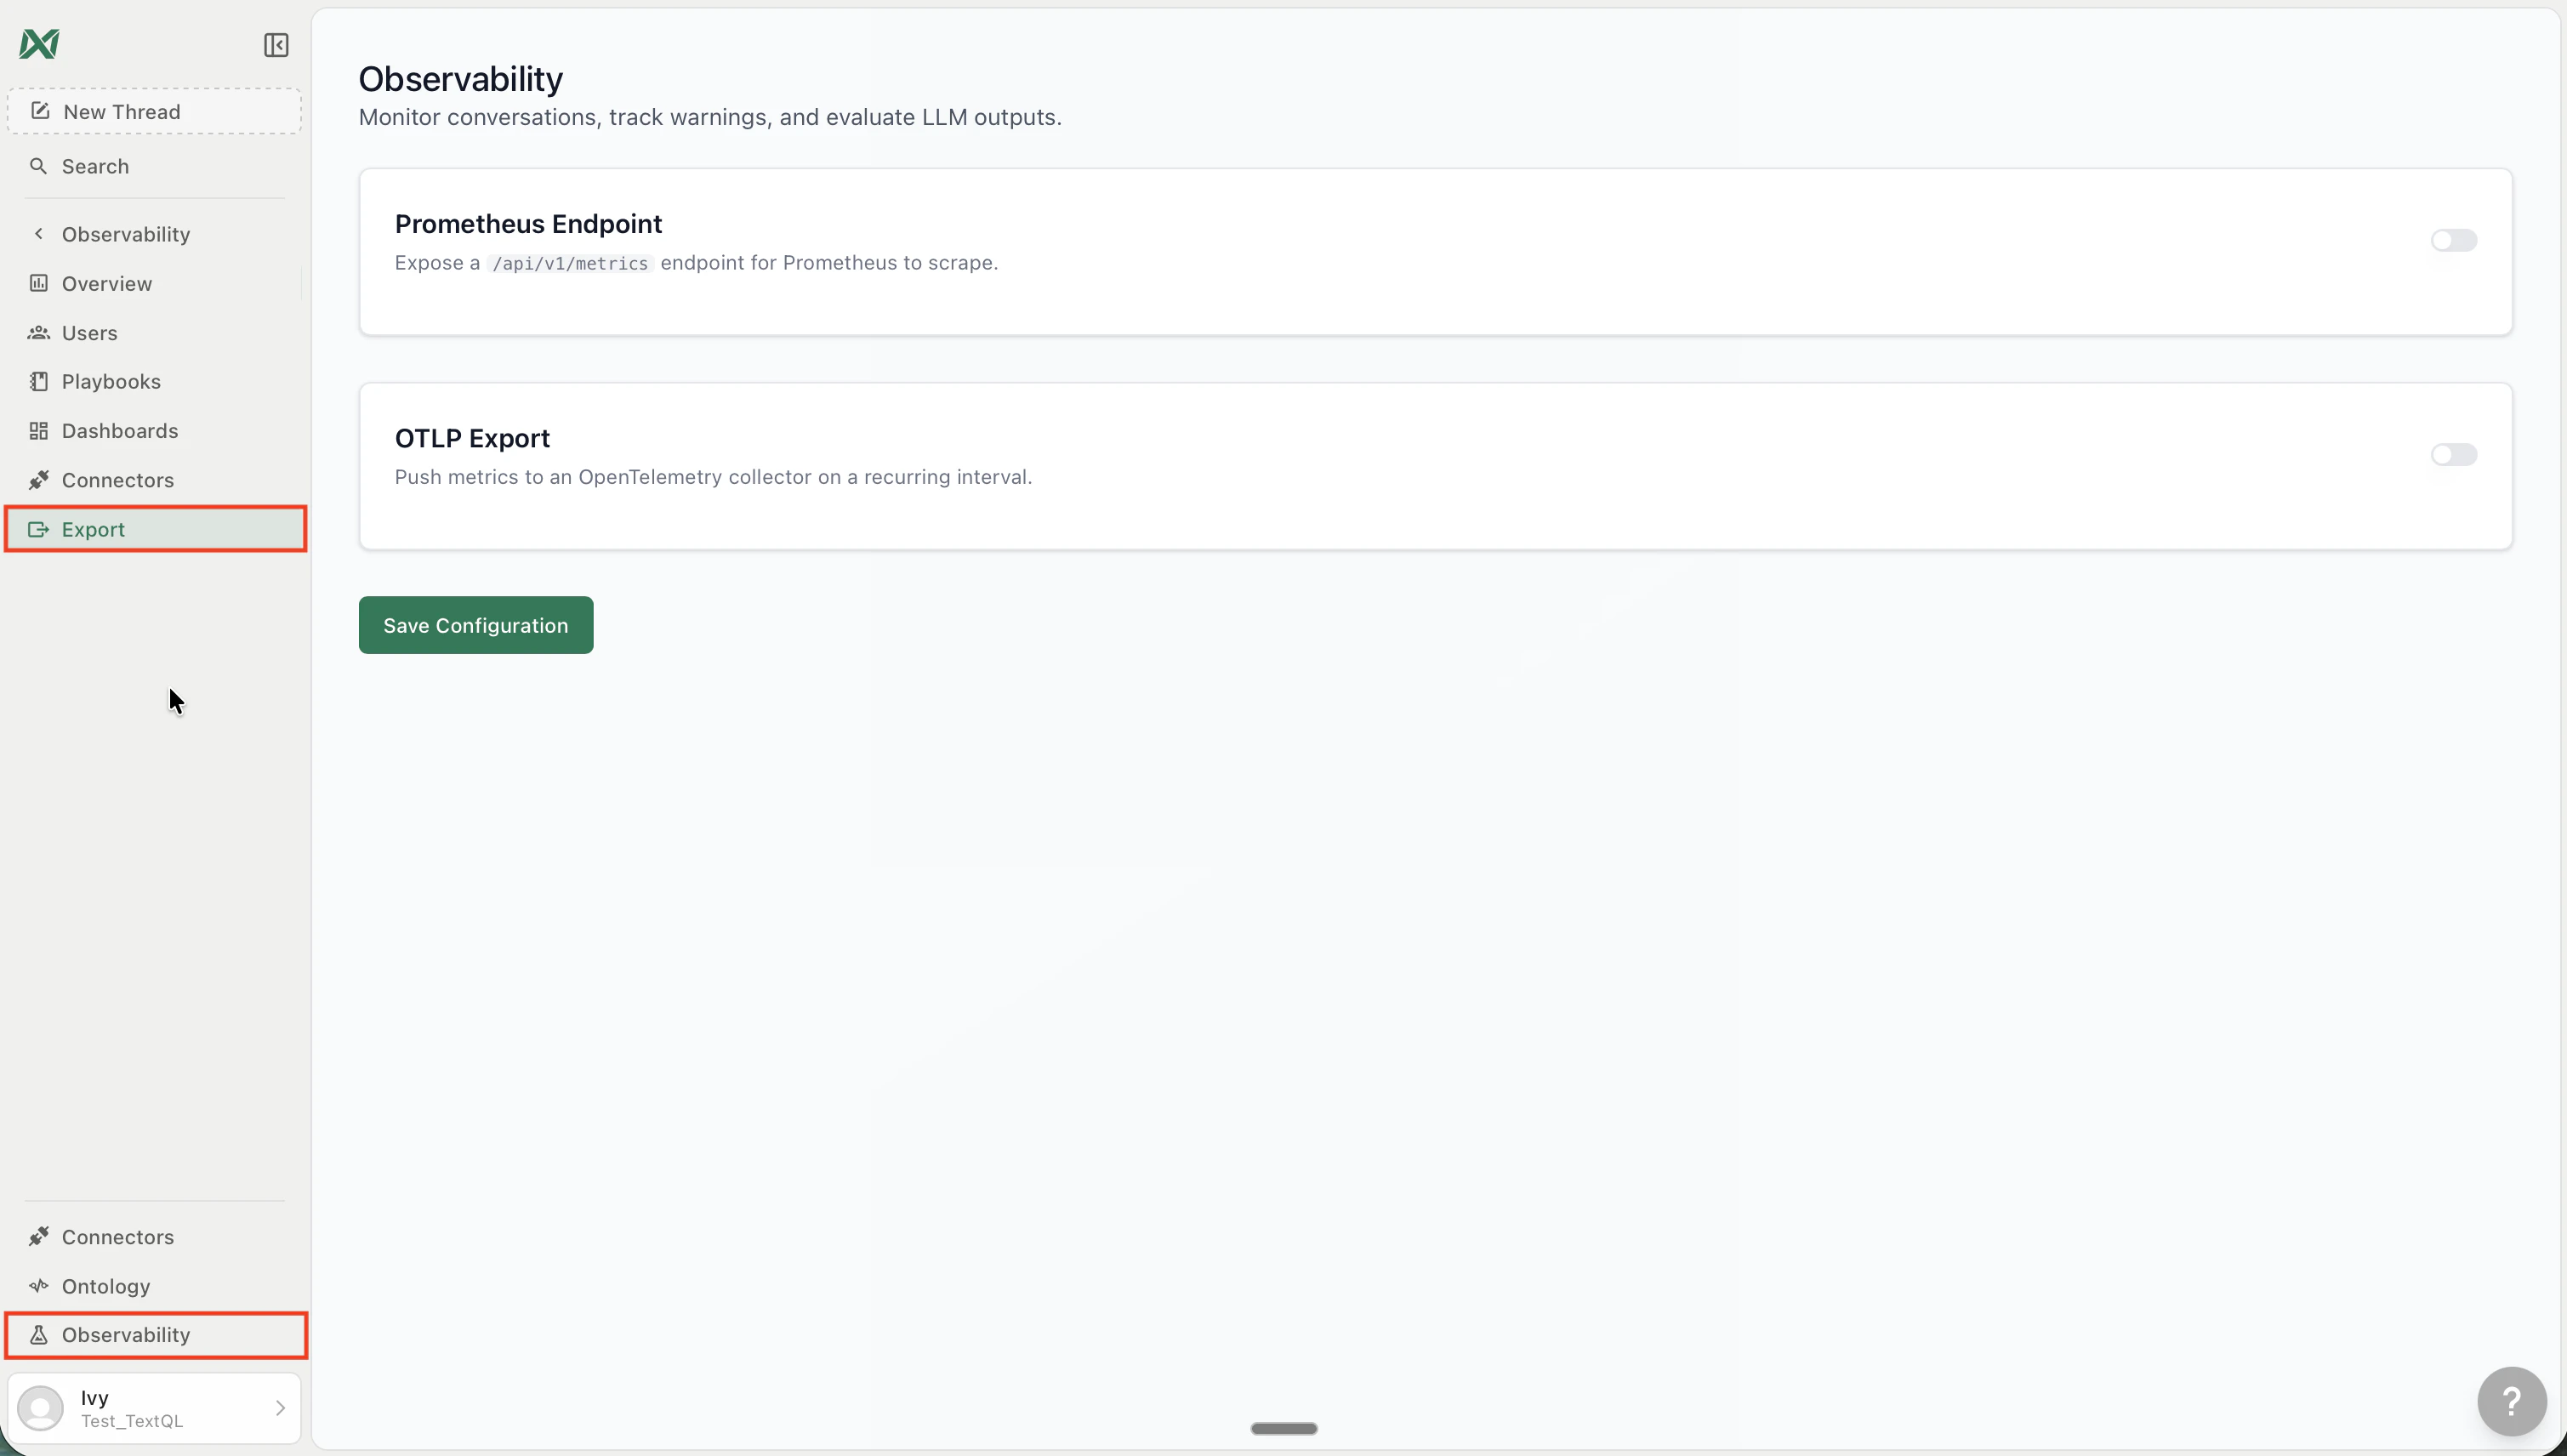
Prometheus Endpoint
Exposes a/api/v1/metrics scrape endpoint that Prometheus can pull from on its own schedule.
To configure:
- Go to Observability → Export
- Under Prometheus Endpoint, toggle it on
- Click Save Configuration
- Add TextQL as a scrape target in your Prometheus config:
OTLP Export
Pushes product metrics to any OpenTelemetry-compatible collector on a recurring interval — Datadog, Grafana, Honeycomb, and others. To configure:- Go to Observability → Export
- Under OTLP Export, toggle it on
- Enter your OTLP endpoint URL and any required headers
- Click Save Configuration
Compatible Tools
Both OTLP streams work with any collector that accepts the OpenTelemetry protocol over HTTP:- Datadog — via the Datadog Agent OTLP ingest
- Grafana — Loki (logs), Mimir or Prometheus (metrics)
- Splunk — via the Splunk OpenTelemetry Collector
- Honeycomb — native OTLP ingest
- Any OpenTelemetry Collector — forward to your existing pipeline
Further Reading
- Audit Log — what actions are captured and how to browse them in-app
- Observability — retrospective thread quality monitoring and warning analysis