Your ontology is built from four main pieces. Think of them like building blocks.Documentation Index
Fetch the complete documentation index at: https://docs.textql.com/llms.txt
Use this file to discover all available pages before exploring further.
Objects (The “Things” in Your Business)
Objects are the main entities in your business. They’re the nouns. Examples:- Customer - People who buy from you
- Order - Purchases made by customers
- Product - Items you sell
- Employee - People who work for you
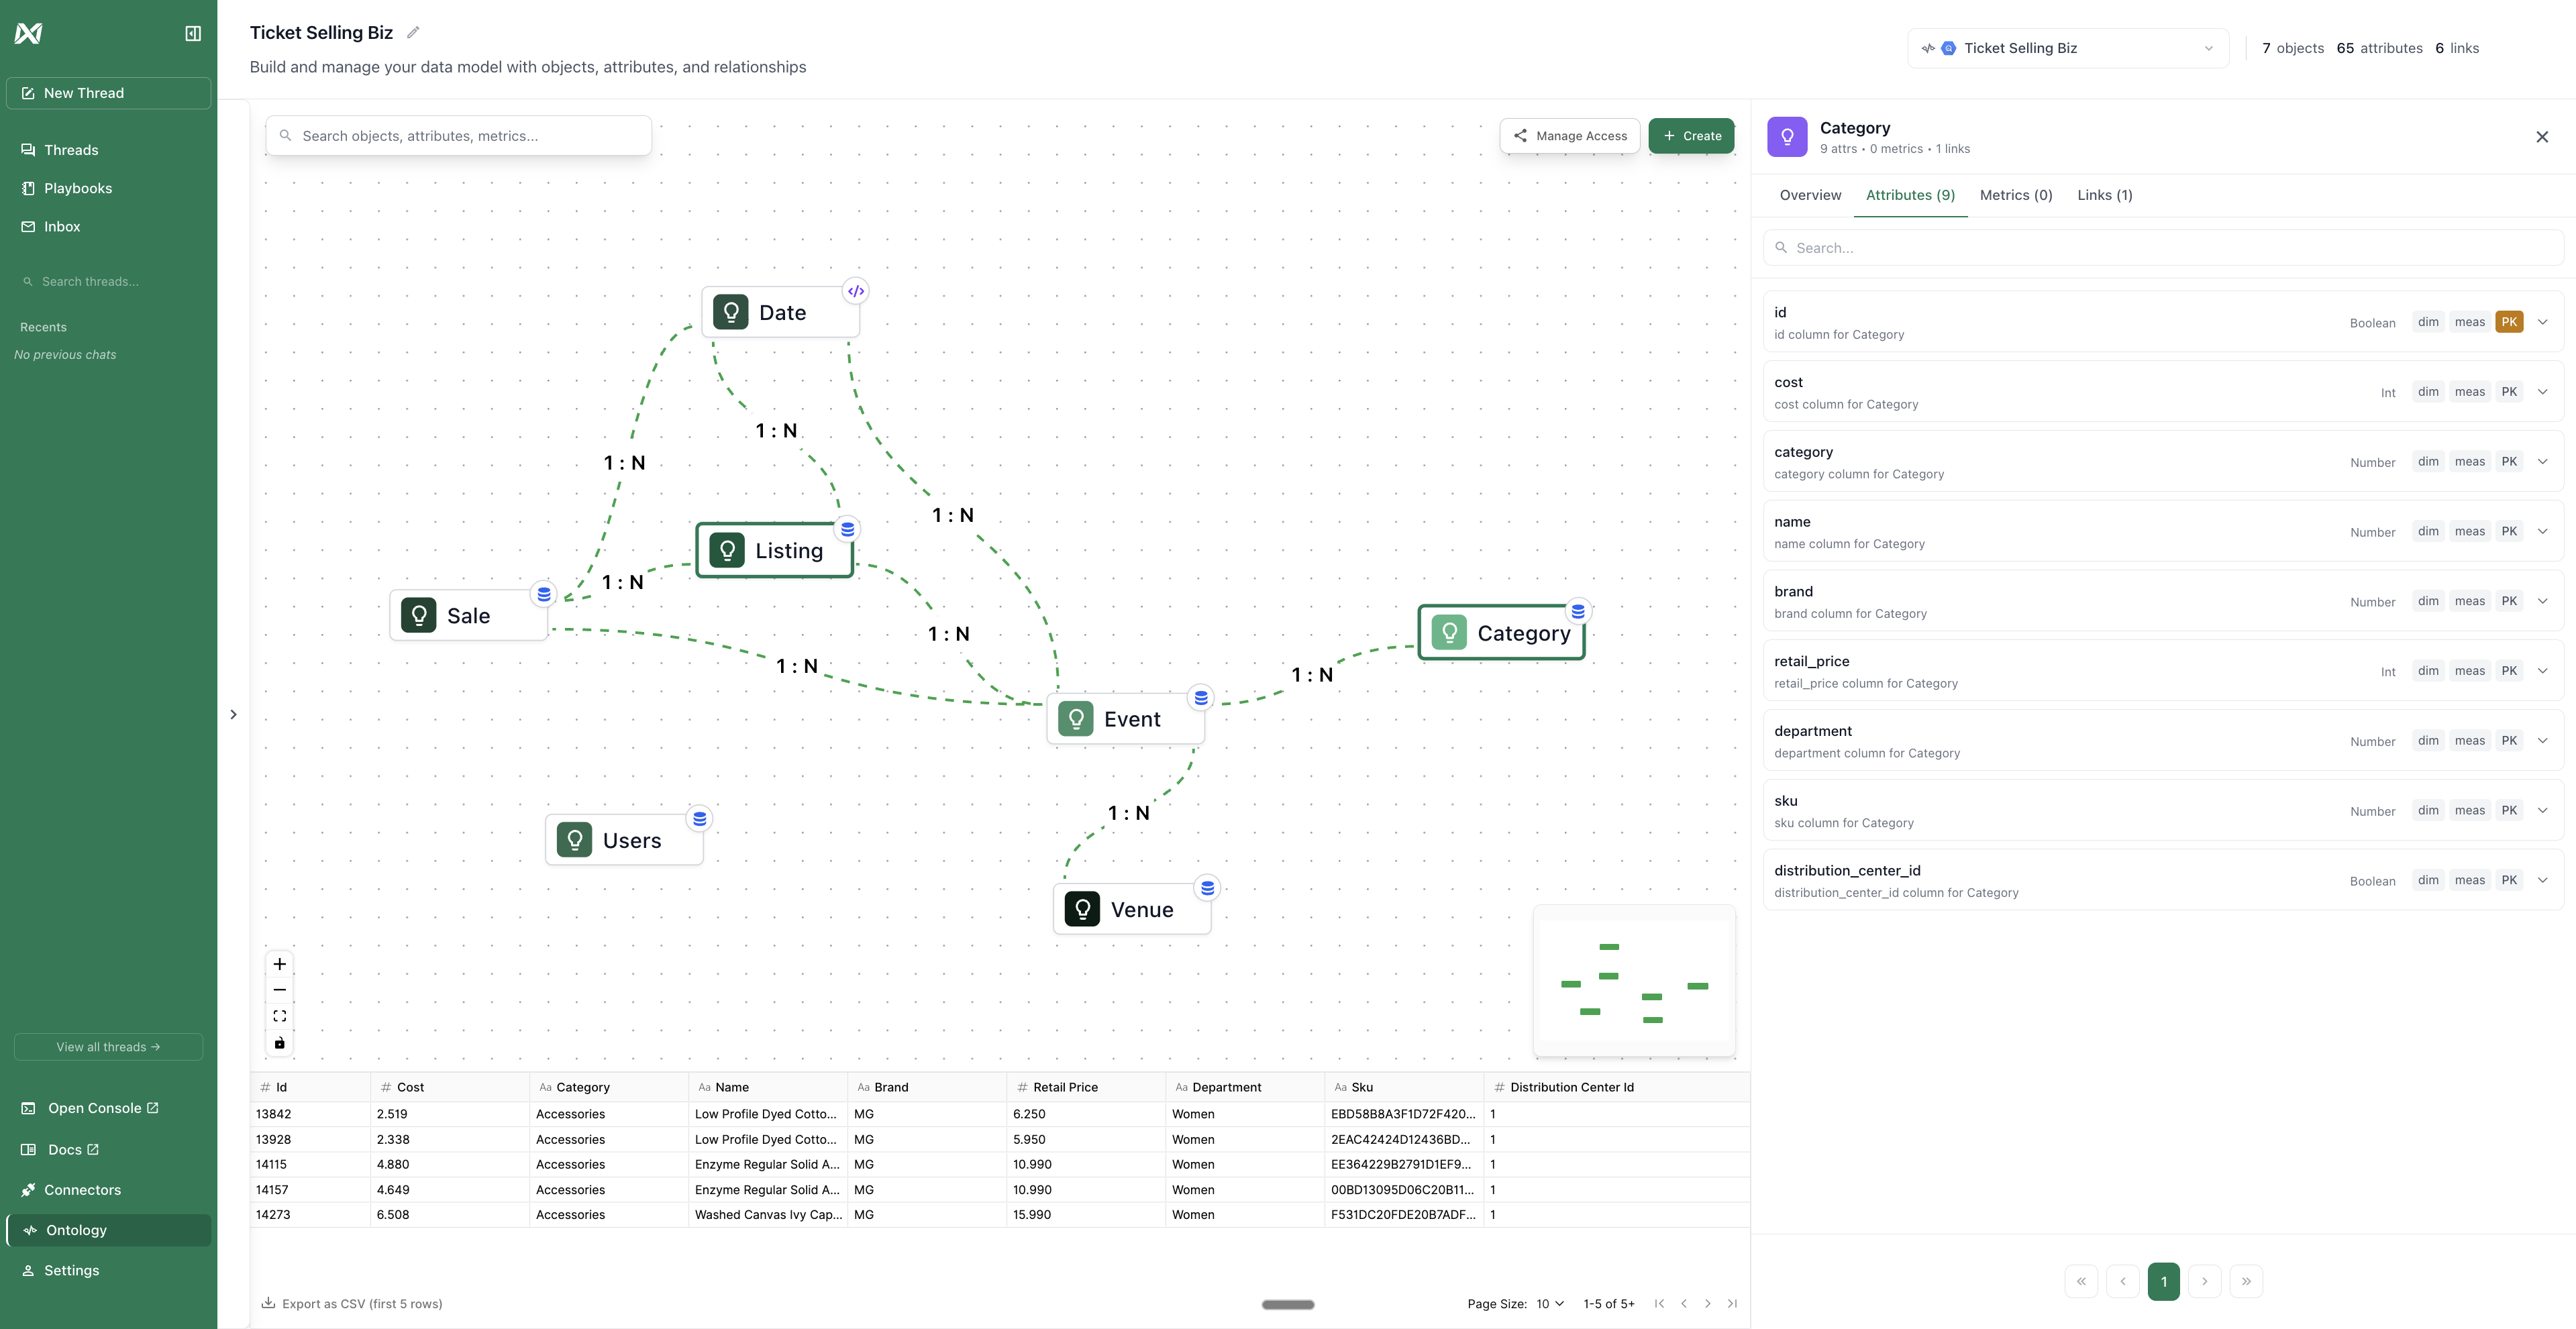
Attributes (The “Details” About Things)
Attributes will auto populate according to the columns within the tables. You’ll need to label each attribute as primary key, dimension, or measure. Primary Key (PK): This is the unique identifier for each row in your object. This is what makes each customer unique and is usually an ID column. Each row must have a different value and there can only be one primary key for each object. Dimension (Dim): This is the descriptive attributes you use to group, filter, or categorize data. Typically, these are text, dates, categories, or anything you would use to “group by” or “filter by”. If you can filter by this, it’s a dimension. Measure (Meas): This is the numeric values you want to calculate with (sum, average, count, etc.). These are the numbers you want to perform math on. Examples:- Customer ID - Primary key
- Order platform - dimension
- Order value - measure
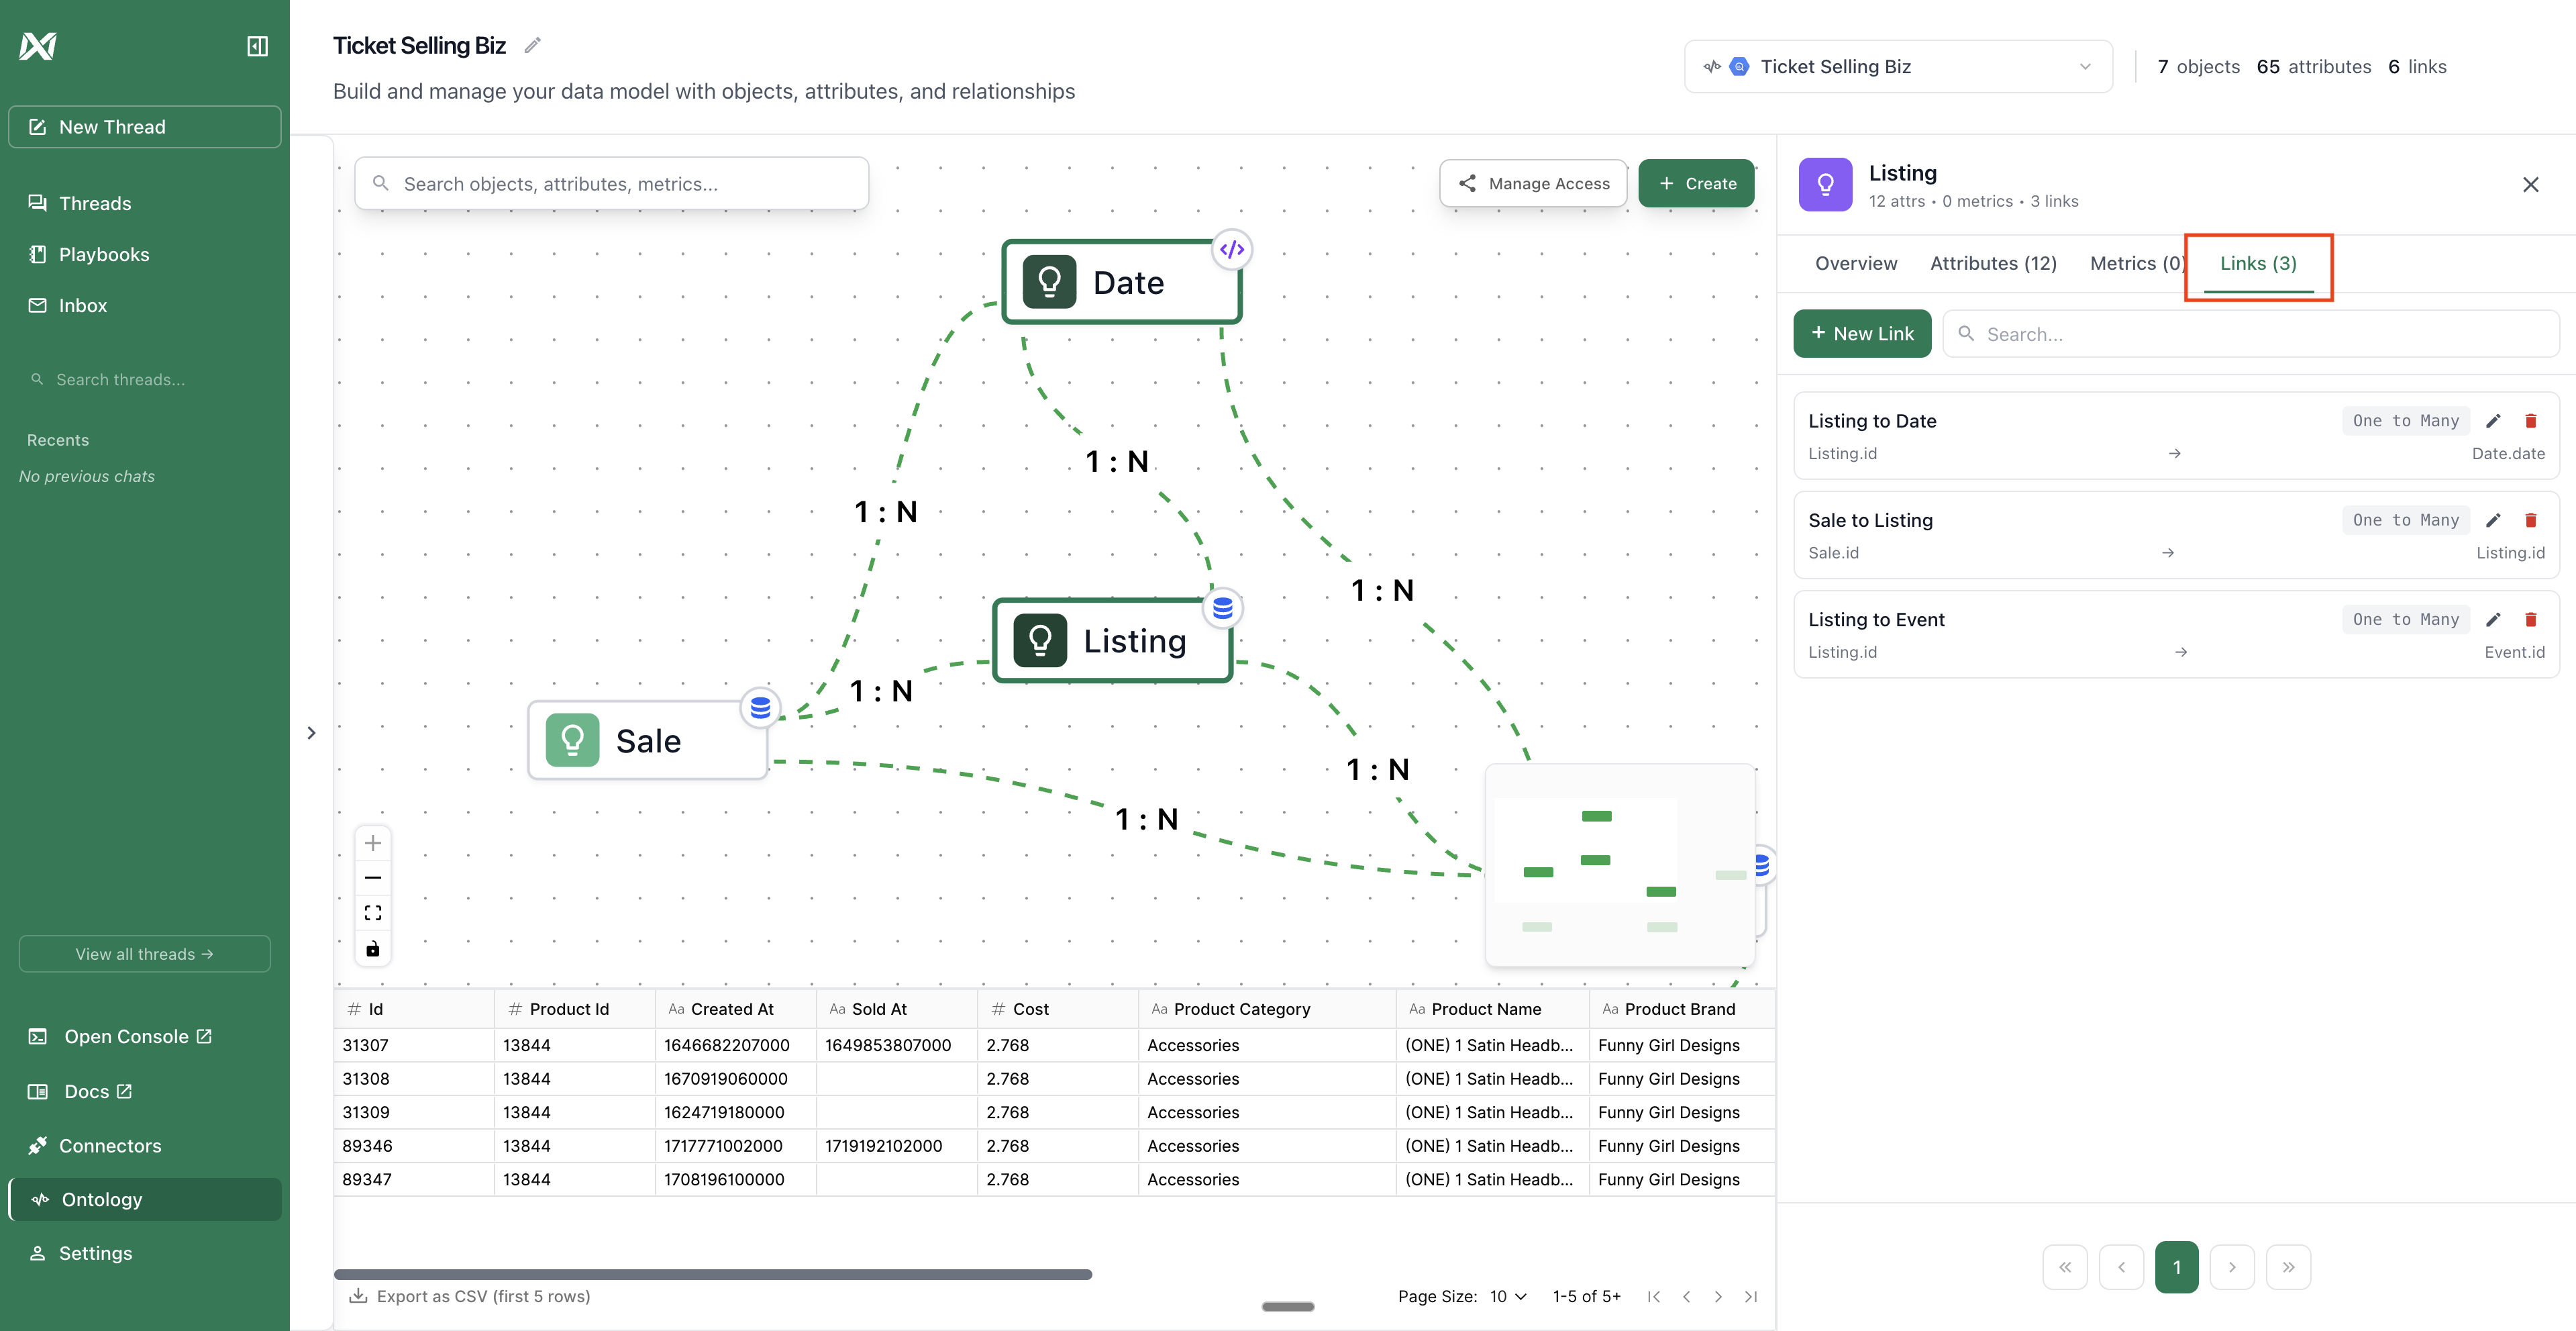
Links (How Things “Connect”)
Links show how your objects relate to each other. They answer “how are these connected?” Two Types of Relationships: One-to-One- One person has one passport
- One employee has one employee ID
- One customer has many orders
- One department has many employees
Metrics (The “Calculations” You Do Repeatedly)
Metrics are pre-defined calculations with exact business logic. They answer “how do we measure this?” Examples:- Total revenue = sum of all completed order amounts
- Average order value = total revenue ÷ number of orders
- Customer lifetime value = sum of all orders per customer
- Monthly active users = count of distinct users who logged in this month